PREVIOUS: Part 7 (Can’t these guys at least LOOK competitive?)
In the last section, we looked at average margin of victory, blowout games, and how these might be affected by recent trends in end-of-game strategy.
In this section, we’re looking at the standings in the most basic manner possible.
Before we get started…
Up through around 11th grade, I was a decent student in math. My test scores always bore this out – if grades were nothing but test scores, I’d have been an honors student with ease.
Alas, that’s not how the world works. And in math, I got dinged almost every step of the way for not showing my work. To me, it was always completely pointless; my mind processed things a heck of a lot faster and more accurately than I could with a pen and paper, so I never felt like showing my work. Most teachers had a problem with this.
Remember way back in the beginning, where I mentioned what I thought talent was? Earl Weaver, who for my money is the best MLB manager of the last half-century, asked, “What difference does it make if a guy is awkward or even spastic if he gets the job done?” This was in reference to his great catcher Elrod Hendricks, who was respectable at the plate and had to fight and work hard to become respectable behind it. (If he coached hockey, Weaver would have been fine with a young Dominik Hasek; a lot of coaches would not have been. Results matter.)
Well, I am no longer in 11th grade, but I still don’t necessarily like showing my work. That’s why this project is such a massive departure from my norm. I am showing work, two decades after the last time I sat in a high school classroom and way past the point that it might positively affect my grades. Oh well.
Quick recap
To this point, we’ve seen various scraps of evidence that the hockey played during the last two years of World War II (1943-44 and 1944-45) may be the worst ever played in the NHL. The first decade (1917-18 through 1926-27) would be like watching a completely different game than what we’re accustomed to today, but the game was rounding into its final form by 1927-28. The final touch in 1929-30 – the legalization of passing of all types in all zones – meant that the game of the 1930s would bear at least a strong resemblance to today’s game.
Of the unrestricted passing era of the NHL, that being 1929-30 to the present, I have little doubt that World War II’s biggest years were simply that bad. It’s nothing against the guys who suited up and played the games, but it is indisputable that a good chunk of players wearing NHL uniforms would not have been in such a position if not for the largest war in history.
World War II is where I first noticed an intuitive error involving a formula I was working with.
Competitive Balance, or Imbalance
For a quick rant, every single year there are accusations that a team or two is “tanking”. “Tanking”, short for “going in the tank” or some variant thereof, is the act of deliberately attempting to not win games for the sole purpose of a more favorable position in the NHL Entry Draft (or the draft of whichever sport is being discussed).
This is different from “throwing games”, in which players or coaches actively sabotage their own team’s chances of winning a particular game, normally for reasons related to illegal gambling or other nefarious activities. The punishment for throwing games from a league standpoint is a lifetime suspension, and the number of times that this has come up in any pro league in the last century is an extremely short one.
“Tanking” refers to actions undertaken by a team’s front office. Perhaps they insist that a team doctor really take his time with a player coming back from an injury. Perhaps they call up substandard players from the AHL, knowing that it may hinder a team’s chances of winning. Perhaps they keep good young players on the bench, or in the minors, or back in junior hockey, in the name of “bringing them along slowly” and “being patient”. Maybe they trade off some of the better players for draft picks or prospects or something that will provide no help in that season, and may specifically hurt the team’s chances of winning games in that season.
Notice that these are indistinguishable from things that middling teams do in the first place. “Tanking” is deliberate and has an ulterior motive, “rebuilding” is done to ensure a better future and anything involving draft position is simply secondary.
I will say this. “Tanking”, in the form of deliberately putting a team in a position to lose games for the primary purpose of a better draft position, is absolutely antithetical to everything that sports is supposed to be about. If a team were found to be actively tanking, draft picks should be revoked, substantial fines levied, and multi-year or lifetime suspensions to the guilty members of the front office handed down.
At the same time, there are far too many people who are convinced that rebuilding and tanking are essentially the same thing, which they are not. But if one is convinced that they are, then it becomes all too easy to float out half-baked proposals to “fix” the draft process.
How many times have you heard it said that “teams shouldn’t be rewarded for being bad”? I can’t count that high, and given enough caffeine and free time, I can count pretty high if I have enough motivation.
The purpose of the entry draft is to ensure competitive balance. That is all. It’s not a “reward”, it’s a mechanism that is designed so that teams suffering through bad years don’t continue to suffer through a self-sustaining series of bad years. What does it look like when a bad team isn’t able to build through the draft? Ask the Oakland Seals.
The Seals
The Oakland Seals were one of the so-called “Expansion Six” class, which began play in the 1967-68 season. And they were awful.
The existing teams drew up some very favorable rules for themselves in the 1967 Expansion Draft. And to add to it, the opening up of the NHL Amateur Draft for the new twelve-team league was of little help – most of the top young talent had already been snapped up by the existing teams in prior years.
The Amateur Draft pretty much lasted as long as it took for all teams to pass on making another selection. The 1967 draft had just 18 selections, and 1968 had 24. 1969 was the first year of what might look like a normal draft, with a (mostly) set number of rounds and picks.
The Seals were terrible in 1967-68, finishing 15-42-17.
So they did something dumb after the first season, trading their 1968 and their 1970 1st-round picks in a move to get a couple of Montreal’s prospects who had yet to stick in the NHL.
And then they did something dumb again almost immediately, trading their 1972 1st-round pick to Montreal in a trade for Bryan Watson. (Watson would be traded from Oakland halfway through the 1968-69 season.)
So to recap, before the 1968 NHL Amateur Draft took place, Oakland was already without their 1st-round picks in that draft, and 1970’s, and 1972’s.
The Seals improved all the way up to a 29-36-11 record in 1968-69.
The next year, they fell back to 22-40-14, which was good enough for a playoff spot by having more wins than the 17-35-24 Flyers.
And now it gets stupid.
On May 22, 1970, Oakland and Montreal made a trade. Oakland, who was a playoff team with 58 points, made a trade with Montreal, a non-playoff team with 92 points.
In it, Montreal gave up their 1970 1st-round pick (10th overall) to Oakland along with Ernie Hicke. In exchange, Oakland gave up their 1971 1st-round pick along with Francois Lacombe. (I should mention that Lacombe had been previously acquired in a different trade involving Oakland and Montreal.)
Don’t worry though; new owner and first-rate jackass Charlie Finley was about to embark on a new era by renaming the team from the Oakland Seals to the California Golden Seals.
One year later, Montreal was hoisting the Stanley Cup, and California was dead-last by ten points over the next-worst team. And that’s how, with Guy Lafleur ended up a Canadien.
This still wasn’t enough. There were lingering issues over how Carol Vadnais had gone from Montreal to Oakland in the 1968 Intra-League Draft, and which finally was settled in 1972…and the settlement saw California’s 1st- and 2nd-round picks in 1973 go to Montreal while receiving Montreal’s 1972 2nd-rounder.
But these weren’t first overall picks any more; California had surged all the way to fourth-worst in the NHL in the 1971-72 season! And then it was right back to second-worst…and then dead last in 1973-74. Then it was third-worst, fifth-worst, and finally off to Cleveland to become the Barons in time for the 1976-77.
From 1970-73, the Seals picked in the first round exactly one time, and they paid a heavy price to acquire that pick in the first place (that being the loss of their selection which became Guy Lafleur).
That’s what happens when bad teams don’t build or rebuild through the draft. To be sure, the Seals had the chance to do so; they simply blew it every opportunity that they could. It was alarming enough that league president Clarence Campbell said that, “If we’re ever going to get parity in the NHL, some embargo must be placed on the trading of amateur draft choices.”
The purpose of the draft is to ensure competitive balance. The Seals are a cautionary tale.
What is Competitive Balance?
Put simply, “competitive balance” is the state at which teams within a closed league are on equal footing.
Think of it this way. In one scenario, a group of thirty-two wealthy investors are brought together and are allocated ten acres of land within a large open field that will be developed. The only thing that will be provided is a road through the development, water and sewer lines, and that’s it. The only requirement for the investors is to build a house, and that’s pretty much it – no other restrictions exist.
In the second scenario, thirty-two wealthy investors are brought together and buy into a development that’s already under construction, and every house and lot look pretty much the same. And there’s an HOA with bylaws and procedures that ensure ongoing compliance, and it’s not one of the petty HOAs run by fools who have a meltdown if leaves fall onto someone’s lawn.
In the first scenario, there will be extremes. Someone of immense wealth may build a 7,000-square foot mansion with a meandering brick driveway which leads to marble pillars at the front, complete with gold fountains and Robin Leach standing there with a TV camera. And someone else may have finally achieved his dream of acreage and can put into action his plan to start a small hog farm. If you’ve never been near a pig farm, they simply smell horrific; hog manure isn’t the worst smell in the world of farming (chicken manure is), but hog farms tend to just reek in general all the time.
In the second scenario, these extremes simply don’t exist. There aren’t the dizzying highs that Robin Leach would spotlight, but neither are there the lows. The outcomes in the second scenario will not be the same; there will be differences in home values, in ongoing maintenance, and in the ability to do what needs done to make something into a home.
In the world of pro sports, competitive balance tends to flatten out extremes. In the early years of any given major league, there are extremes all over the place: in baseball you’ll find hitters with extremely high batting averages and with extremely low ones, in football you’ll find teams who outscore their opponents by forty points a game, in hockey you’ll find gaudy scoring stats and team stats. And it takes place year after year after year, and eventually flattens down as time progresses, as the league stabilizes, and as more talent is found and put into the lineup.
A few things drive this:
- In the early days, owners had to pay a nominal franchise fee to join a league. Actually operating teams, even then, was an expensive proposition – someone of little means would be out of money and out of the game very quickly.
- A team with little operating capital would be unable to attract talent of any type; no player would give up his day job to take a pay cut in order to play football (or baseball, or hockey) for a team that may not survive the season.
- Scouting talent is expensive and requires connections, which someone of limited means would be unable to do. In the days before a draft of young players, this meant actually watching games all over the country, soliciting recommendations, and building and maintaining relationships with coaches and others.
- Keeping talent in the days of an unstable league and a shortage of legal precedent meant being able to defend contracts and league bylaws in court, which someone of limited means would be unable to do.
As time progresses, owners of limited means fall away and are replaced with people who were more well-heeled, who were able to attract and keep better talent. And on the field of play, rule changes were made constantly in order to provide an entertaining product and to maintain the essence of what the game was supposed to be about.
In the early days of baseball, by which I mean the 1870s, there was a fine hitter named Ross Barnes. His batting averages in six years of play were .401, .430, .431, .340, .364, and .429. And then it dropped to .272 for the 1877 season. Why?
In baseball today, a ball which is in foul territory before reaching the corner bases (first or third) is a foul ball, even if it first landed in fair territory. In Barnes’ first six years, this was not the case – if a ball first landed in fair territory, it was a fair ball regardless of where it ended up and when. Before the 1877 season, the rule was changed to the modern one. And Barnes, who had exceptional control and skill and had mastered the act of tapping a ball into fair territory which then rolled foul, was unable to adjust to it. Whether one regards his specialty of a fair-foul ball as a cheap gimmick or as a sign of incredible skill and finesse isn’t the point.
(The rest of Barnes’ career came after a serious illness; he played in the aforementioned 1877 season, but then not again until 1879, and then 1881. That was his final year of pro ball.)
If you’ve been following along in this entire series on talent dilution, you’ll undoubtedly have seen a lot of charts. In all cases, the early years of the NHL look way out of whack compared to pretty much any later time period – leaguewide scoring was both the highest and the lowest in history, margin of victory was the highest and the lowest in history, and there will be more to come in the pages and sections that follow. Elimination of the extremes is a sign of an improving league; we may not be able to point to a specific number and say “good league here” or “bad league here”, but we can absolutely reference the flattening of these extremes as a sign of a better league.
The Formula
There is a way to measure competitive balance within a league within a given season. I just had to work past my own tendency to overcomplicate things first.
A balanced league is one in which teams cluster very closely to each other in the final standings. Since standings, much like statistics, are balanced against each other, this is the mid-point of the standings: a .500 record. So what we’re looking for is deviation from a .500 record.
My initial foray into the league standings involved standard deviations, but since half of NHL history was with either a changing league or one with just six teams, I dismissed this as a bit superfluous. This was scrapped in favor of a simple deviation formula, seen below.
Here’s how it’s done: “wins”, “loss”, “ties”, and “points” are all pretty much self-explanatory. “Variance” is simply the deviation in points from a .500 record, and “square” is that number, squared. The number in teal below that is the overall average of the squares, and the red number is the square root of that.
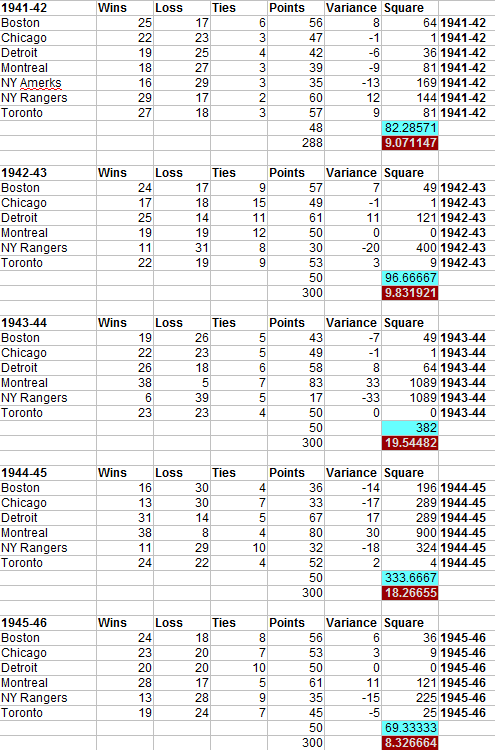
The competitive imbalance is the red number to the bottom right on each cluster of standings: 9.07 in 1941-42, 9.83 in 1942-43, 19.54 in 1943-44, 18.26 in 1944-45, and 8.32 in 1945-46.
So it appears, once again, that the last two years of World War II again are the worst there are – they’re massively unbalanced to a much greater extent than should be possible.
And it worked! It’s an overall deviation, and I was happy with it and thought I’d stumbled onto something.
Now, see what changed my mind.
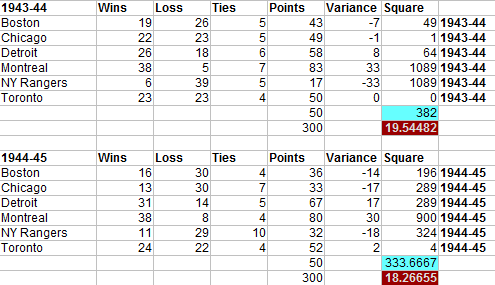
The 1943-44 season shows up as more unbalanced than the 1944-45 season, which may make some shred of sense since 1943-44 had both a better and a worse extreme team than 1944-45. But four of the league’s six teams were within eight points of a .500 record, which is fairly well balanced. In 1944-45, only one team is within thirteen points of a .500 record, and the league as a whole is hideously unbalanced. Yet this formula shows that the latter year is more balanced than the former, which is as absurd as it sounds.
And so I looked at it, much like Norm Schachter did when Pete Gogolak double-kicked a field goal, and had to work out why it wasn’t right. Intuitively I knew it wasn’t right; I just didn’t yet know why.
So I did what I should have done in the first place, which was to create a test league. This is the 2012-13 season, and I figure that a league in which half the teams went 82-0-0 and half the teams went 0-82-0 would represent the absolute height of imbalance.
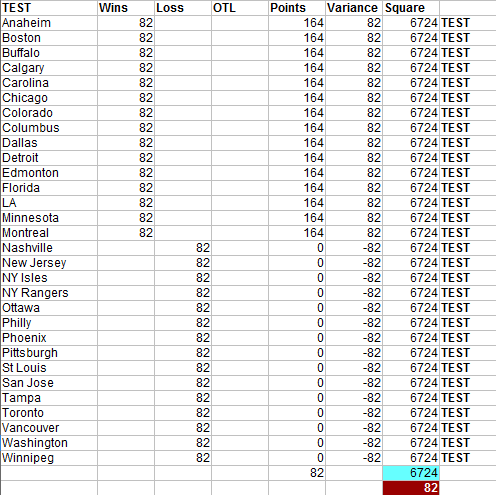
Using the same formula as above, we can see that the average is an 82-point deviation, which is exactly what would be expected. But intuitively it’s not right; it simply caps how unbalanced a league could possible be. If it were a 50-game schedule, the most that it would show is “50” as the ultimate number. If it were a 120-game schedule, it could show “120”. This leaves us with a raw number that, without establishing some level of context, would simply skew heavily across time based on changes in the schedule.
As I’ve said a half-dozen times already, we’re looking for illumination and not obfuscation. So this formula, practical though it may be, simply does not work as intended. Square roots increase exponentially, so a higher extreme carries a disproportionate weight.
Let’s take a simple run of four consecutive numbers: 2, 3, 4, and 5. The square of these are 4, 9, 16, and 25. Add those together and you get 54. The square root of 54 is 7.348.
Now take 3, 4, 5, and 6. The square of these are 9, 16, 25, and 36. Add these together and you get 86, which has a square root of 9.274.
Move that up one more, to 4, 5, 6, and 7. The square of these are 16, 25, 36, and 49. Added together, that’s 126, which has a square root of 11.225.
10, 11, 12, and 13 have squares of 100, 121, 144, and 169. Added together yields 534, of which the square root is 23.108.
No matter how you cut it, greater extremes skew the end result heavily. And that’s without taking schedule length changes into account at all.
So I revisited the test league to iron out the issues, and I felt compelled to show my work because it might be a smart thing to do.
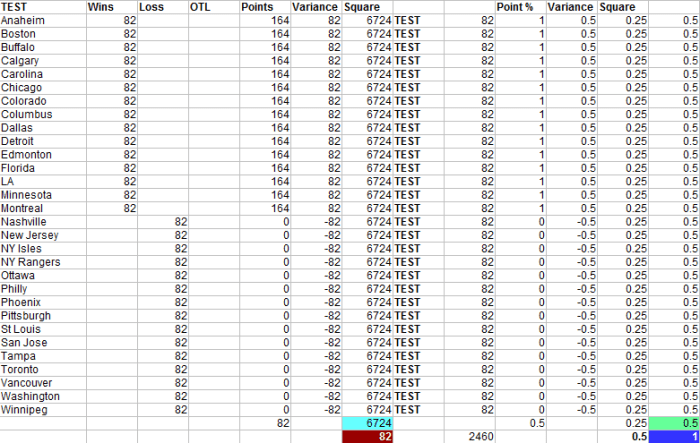
The right side (everything to the right of “test”) is what we’re looking for. The first unmarked column with those 82s is simply a positive version of each team’s deviation from .500. “Point %” is the team’s point percentage on the year, which in this case is either 1.000 or .000. “Variance” is the point percentage variance from .500. “Square” is the point percentage squared, and that last unmarked column is the positive version of “variance”.
Then that green number in the bottom right is the average of that variance, but you can see that even in this grossly unbalanced league, it caps at .500 – no team could be anything more than .500 away from .500. Accurate as this may be, it doesn’t quite get there. I’d rather have the average point deviation from .500, expressed as a percentage. If this league is absolutely as unbalanced as it can possibly be, it should be 100%.
So, since a win is a single win but is two points in the standings, the blue number is the green number multiplied by two. And now we have our test league, 100% unbalanced, and a number and formula which accurately reflects that it is 100% unbalanced.
And this means going back up to those World War II years, running it through there, and seeing what happens.
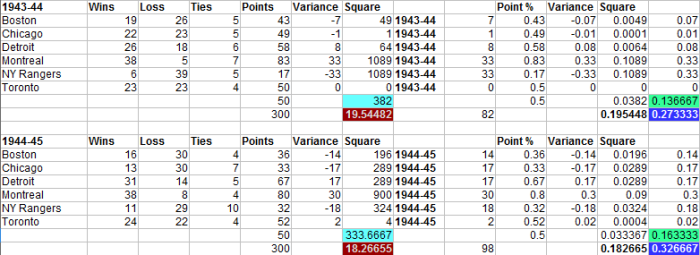
And there is it: 1944-45 is significantly more unbalanced than 1943-44, and it’s a simple and common sense way to arrive at the conclusion. I should have figured it out a while ago, since a total 82-point deviation is not more unbalanced than a 98-point one, but that’s neither here nor there.
What makes the two years above look redundant is because the NHL had a 50-game schedule (with a maximum 100 points per team), so everything appears to be unusually balanced anyway. In 1946-47, in which the league went to a 60-game schedule, the math to the left of the bolded year column and the math immediately to the right no longer match.
How much has competitive balance changed over the years, and does expansion have an impact on it? The following chart shows imbalance; a higher percentage is a more unbalanced league, and a lower one is a more balanced league.
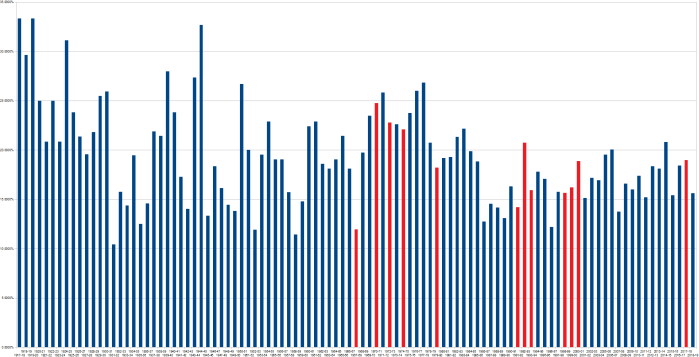
Now, you may wonder how this deals with changes in the league standings over the last twenty years. So here’s how the above chart is compiled:
- The 1917-18 through 1998-99 seasons are exactly as they would have appeared in the newspapers: wins-losses-ties. This will produce a league in which an average record is .500.
- 1999-00 through 2003-04 were years in which a game could finish in a tie if no one scored in the five-minute overtime period, or a team that lost a game in overtime would still get a point in the standings. For these five years, I simply shift it to a W-L-T record: the L column is regulation wins plus overtime wins, and ties remain their own separate column. This still produces a league where the average record would be .500, rather than what it actually is.
- 2005-06 through 2018-19 has the baseline set to a .500 point percentage, rather than what the league average actually is. This is arbitrary on my part, but I’m not done yet.
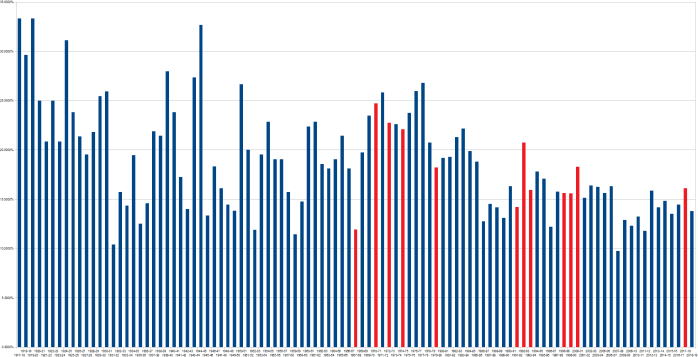
What would it look like if the standings since 1999-00 were simply untouched and left as they actually were, with the league average set to what the league average was instead of changing things to a different standard?
The answer is here:
And in case you were wondering how much an average team’s standings points has changed over time, specifically since 1999-00:
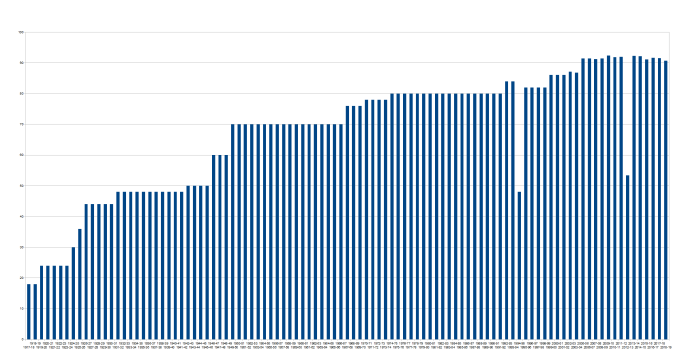
The answer to that question is “not much”. You can see the way it’s changed as the schedule has grown over the years, and the two big divots in 1994-95 and 2012-13 from lockouts, but outside of that there hasn’t been a ton of movement in the last twenty years. The range from 1999-00 through 2003-04 was contained from 86.033 to 87.167, and starting in 2005-06 it’s been between 90.742 (2018-19) and 92.367 (2009-10). The low-water mark in 2018-19 is an aberration; the previous low in this range was 91.167, and only time will tell where this line continues to shift in the future.
So far, it does not appear that competitive balance shifts dramatically due to, or around the time of, expansion. But is there more than meets the eye?
Other Factors
The first year of the NHL (1917-18) is simply impossible to account for – the league began its schedule with four teams, and finished with three. On January 2 1918, a fire broke out at Montreal Arena, home of the Canadiens and the Wanderers.
The venerable rink was home to a great amount of history. When it was built – possibly just the third rink in the world built exclusively for hockey – the corners of the rink were rounded off instead of squared, and a four-foot retaining wall was built around the surface. The arena had hosted the first game in NHL history just two weeks prior, and saw Wanderers defenseman Dave Ritchie score the first goal in NHL history. And then, just like that, the rink – and the equipment belonging to half of the NHL’s four teams – burned to the ground.
The Canadiens raised enough money to replace what had been lost, but the Wanderers were unable to do so and folded just six games into the league’s first season.
The official standings have the Wanderers with a 1-5-0 record: 1-3-0 on the ice, and 0-2-0 due to forfeits. The other three teams played a 22-game schedule, but it creates an 18-point league average for the first year. Thankfully, this is the only year thus affected.
From 1926-27 through 1930-31, teams played divisional opponents six times each and non-divisional opponents four times. In 1931-32, this became eight and six, respectively.
In 1932-33, a balanced schedule was restored – teams played opponents six times each through the end of the 1934-35 season.
From 1935-36 through 1937-38, it was back to and eight-and-six unbalanced schedule.
In 1938-39, after the demise of the Montreal Maroons, a balanced schedule was adapted. This would remain the standard for the next three decades.
Modern Expansion and Factors
If you look at the charts of competitive imbalance, it would appear that 1967-68 featured an immense shift toward a more balanced league, followed by a sudden lurch in the opposite direction.
When the league doubled in size for the 1967-68 season, the schedule increased from 70 to 74 games. In addition, the league was split between the six existing teams (East Division) and the six new ones (West Division). After thirty years of a balanced schedule, it was going to change.
For 1967-68, teams played their five divisional opponents ten times each, and their six non-divisional opponents four times each. While the league appears to be fairly well balanced, with eleven of the twelve teams netting between 66 and 94 points, this may be an illusion of sorts.
- Montreal was 2-2-0 against Los Angeles, 2-1-1 against Minnesota, 3-1-0 against Oakland, 2-1-1 against Philadelphia, 4-0-0 against Pittsburgh, and 3-0-1 against St. Louis. This gave them 35 of a possible 48 points (.729 point percentage) against the newcomers, compared to 59 of a possible 100 (.590, obviously) against their longtime rivals.
- New York was 17-4-3 against the new teams (.771 point %), and 22-19-9 against the old (.530).
- Boston was 14-9-1 against the new teams (.604 point %), and 23-18-9 (.550) against the old.
- Chicago was 15-4-5 against the new teams (.729) and 17-22-11 (.450) against the old.
- Toronto was 10-11-3 against the new teams (.479) and 23-20-7 (.530) against the old, which is as strange as it sounds. They also had a garish home/road split, going 24-9-4 at home and 9-22-6 on the road.
- Detroit was 14-7-3 against the new teams (.646), and 13-28-9 (.350) against the old.
- Of the six new teams, only Los Angeles (10-12-2) was remotely respectable against the old guard.
So it’s established that, with the exception of Toronto, the old teams largely feasted on their new brethren with extreme prejudice. The total record of the six old teams against the six new ones is 86-40-18, a .6597 point percentage. In today’s 82-game schedule, that’s a 108-point pace. Actively hindering matters was Toronto’s sub-.500 record against the new teams, further proving that since winning the Cup in 1967, Toronto has been unable to do anything right.
Fast forward one year, with the schedule further expanding to 76 games. The NHL took the opportunity to adjust the schedule framework a bit, changing it from ten games against each conference opponent and four against non-conference to eight-and-six. One can only imagine what the motive was for this, but knowing who the power brokers of the league were at the time, I can fathom a pretty good guess.
The results were ghastly:
- Montreal was 25-5-6 against the new teams (.778 point %) and 21-14-5 (.588) against the old
- Boston was 23-7-6 against the new teams (.722 point %), and 19-11-10 (.600) against the old.
- New York was 24-8-4 against the new teams (.722 point %), and 17-18-5 against the old (.488).
- Toronto was 18-8-10 against the new teams (.639) and 17-18-5 (.488) against the old.
- Detroit was 18-13-5 against the new teams (.569), and 15-18-7 (.463) against the old.
- Chicago was 21-10-5 against the new teams (.653) and 13-23-4 (.375) against the old.
Against the new teams, the old teams posted a total record of 129-51-36, a .681 point percentage that translates to a 111.6-point pace in an 82-game schedule. So not only was the percentage higher than the year before, but there were 50% more cross-divisional games being played as well. The standings range in the East in 1967-68 was from 66 points up to 94, and just one year later it was from 77 up to 103. In the West, the teams in 1967-68 had 73, 72, 70, 69, 67, and 47 points. One year later, with this re-tooled schedule, it was 88, 69, 61, 58, 51, and 51. And St. Louis, the division champion with 88 points, was 27-8-5 against their own division and 10-17-9 against the East.
1969-70 saw the schedule framework stay the same, and the results were pretty much entirely the same. The six old teams plus St. Louis absolutely pummeled the West, and the five new non-St. Louis teams pretty much got annihilated.
More Expansion
Buffalo and Vancouver joined the NHL for the 1970-71 season, and the NHL powers-that-be showed their solid grasp of geography by putting both in the East Division while moving Chicago to the West. The new 78-game schedule was balanced, with each team playing each opponent six times. It remained this way through the next season, when further expansion changed things.
For the 1972-73 season, the NHL welcomed the New York Islanders and the Atlanta Flames and split the expansion teams: the Islanders to the East, and Atlanta to the West. This meant that the East stretched from Long Island all the way to Vancouver, and the West all the way from Philadelphia and Atlanta clear out to Los Angeles and Oakland.
The schedule took on an odd element, with each team playing twelve of their fifteen opponents five times each, and the remaining three opponents six times. The latter grouping were clustered into pods:
- Atlanta, St. Louis, Chicago, and Minnesota
- Boston, Buffalo, New York (Islanders), New York (Rangers)
- California, Los Angeles, Philadelphia, and Pittsburgh
- Montreal, Detroit, Toronto, and Vancouver
For 1973-74, the framework was the same but the pod system was ditched in favor of what looks like complete random choice.
But expansion wasn’t done yet! Washington and Kansas City were added for 1974-75, meaning that the league could split into two nine-team conferences, and each conference could split into divisions of five and four teams. And for a finishing touch, the higher-ups decided that since geography was far too complicated, they should take the opportunity to rename the divisions and conferences after themselves.
- The Campbell Conference was named after sitting NHL President Clarence Campbell, who had yet to be indicted for bribery but would be just a year later.
- The Wales Conference was named after the Prince of Wales, who later became King Edward VIII, who is best known for abdicating the British throne after less than a year and for being a possible Nazi sympathizer.
- The Norris Division was named after late Red Wings owner James E. Norris, for whom having the league’s trophy for best defenseman as an honor simply wasn’t enough. This also was in no way related to the fact that his son Bruce Norris had inherited the team and still wielded immense clout. (If you can’t remember which of Bruce Norris or his half-brother James D. Norris broke the NHLPA or yanked Baltimore’s already-awarded expansion team in 1966 to give to St. Louis in order to divest himself of the dilapidated St. Louis arena, it’s probably best to just shrug and move on.)
- The Adams Division was named after late Bruins founder Charles Adams, who was also known for having his MLB team (the Boston Braves) taken from him.
- The Smythe Division was named after Conn Smythe, founder of the Toronto Maple Leafs, builder of Maple Leaf Gardens, and longtime opponent of NHL expansion. In its first year, the Smythe Division would have four expansion teams plus Chicago.
- The Patrick Division was named after Lester Patrick, founder of the New York Rangers and unusual among this group of power brokers by having apparently lived his entire life without being a total bastard.
The schedule framework for 1974-75 was needlessly complex as well.
Frankly, I think I’m starting to labor the point a bit. That the 1967-68 expansion caused a drop in competitive imbalance (and therefore an increase in competitive balance) appears to be at least something of an illusion that is largely brought about by the schedule framework of that year. When it changed the next year to where the schedule was more balanced than it was in 1967-68, the imbalance returned to roughly the same level that it was in 1966-67 and earlier.
Modern Expansion
From 1986-87 to 1990-91, the league shows an imbalance of 12.74%, 14.52%, 14.17%, 13.10%, and 16.31%.
1991-92 saw San Jose enter the NHL and look more like a middling IHL team than anything. We would expect the imbalance to rise, but instead it dropped from 16.31% down to 14.20%.
In 1990-91, teams in the Wales Conference played 30 games against the Campbell and 50 against their own conference; teams in the Campbell played 33 against the Wales and 47 against their own conference. In 1991-92, both conferences played a 50-and-30 schedule, with San Jose’s entrance balancing the conferences back to eleven teams each.
In 1992-93, with Ottawa and Tampa Bay entering the NHL, the imbalance surged to 20.73%, as teams played either 25 or 26 games against non-conference opponents and 58 or 59 games against their own conference.
In 1993-94, the imbalance dropped down to 15.93% as Anaheim and Florida entered. Teams played either 24 or 26 games against the other conference (now thankfully renamed to the Eastern and Western), and 58 or 60 against their own.
Balance remained mostly unchanged in 1998-99 (Nashville) and 1999-00 (Atlanta). But then it shifts big-time in 2000-01 (Columbus and Minnesota), either from 15.59% to 18.28% or from 16.20% to 18.86% (depending on which chart and methodology outlined above is used). There would be massive swings all the way through the end of the 2006-07 season, but I would argue without a great deal of research that two big factors can explain this:
- The immense shift in talent as a direct result of the economic upheaval during the years that the 1995 CBA was in effect. As well-heeled owners entered the game and began an economic war, salaries skyrocketed and smaller markets were left behind. The conditions of the game off the ice effectively served to funnel top-level talent, and good depth players who were becoming increasingly expensive, to the larger markets at the expense of the small ones. If you don’t remember it or weren’t alive for it, I go into some detail with Free Agency From 1995-2004 – The Group II Cold War.
- As the salary cap entered the league in the 2005 CBA, teams shuffled their rosters all over the place in order to both fix their current condition and to set up for the future. This was not an overnight process, and as the economic conditions stabilized, competitive balance returned.
- There was an immense drop from 2006-07 (16.31%) to 2007-08 (9.73%), for which more research is needed. The NHL went from eleven 100-point teams down to three, and from five sub-72-point teams to one.
- Some of it in either direction can be explained; for example, Nashville going from 110 points down to 91 is almost entirely due to the loss of five key players on the orders of an incoming owner who never bothered to actually complete the purchase of the team. As a friend of mine who is a lawyer has previously advised me to avoid making public statements that could cause litigation to be considered by other parties, I’ll hold my tongue on the rest of that.
Conclusions?
As a whole, expansion does not appear to be a catalyst for competitive imbalance to any lasting extent.
It appears that only the unusual change in competitive imbalance from 1967-68 to 1968-69 can be even partially explained by dramatic changes in the actual framework of the schedule. The rest of it appears to be fairly normal, and largely unaffected by schedule changes.
Years that bear out further research for competitive imbalance in general are the 1992-93 season’s enormous spike, and 2007-08’s enormous drop. I believe that the former can be explained by the onerous expansion framework that the new teams had to deal with, and the latter by external conditions unrelated to expansion in any way.
