I wasn’t originally planning on this becoming a two-parter, but I got a bit carried away, and 10,000 words later, I made the choice to split it up.
If you haven’t read Part 1, you may want to do so as a quick primer of what I’m looking to do. If not, the short version is that I’m looking at the first-year rosters of the ten most recent expansion teams to determine if there is a correlation between prior pro experience and early success of an expansion team. I’m also going through everything as I go, rather than writing all of this and then publishing it. It’s as new to me as it’s being written as it is for you when you read it.
To very quickly sum up a bit of Part 1:
- Top-level players are generally in the NHL at an early age, and play either very few non-NHL pro games or college/junior games in their 20-year-old season or afterward.
- Even players who are considered “late bloomers” do not show extremely large numbers of games in the latter two categories; their talent becomes evident fairly early on. Almost all NHL stars are solidly established as everyday players by age 22.
- As is the case with any type of analysis, it’s possible to take this argument too literally. I did not do an all-encompassing breakdown by age or category when determining “NHL stars established by age 22”, but rather went with a smaller sample of players who are considered to have begun their NHL careers later than other star players.
Without further ado, I give you Part 2.
The Data
How to read the tables, and the glossary:
- “NHL” refers to NHL regular season games played in by the player before the expansion season in question.
- “Other” refers to other pro regular season games played in before the expansion season. This includes North American minor league games, and also European professional games.
- “Jr/Col +20” refers to college or junior hockey games played in by a player in his age 20 season or older.
- “1991-92” (or other year) is the number of games that the player suited up for with his expansion team in that season.
- “WtNHL” are weighted NHL games: his prior NHL experience multiplied by the number of NHL games he played in the expansion year.
- “WtPro” are weighted other pro games: his prior other pro experience multiplied by the number of NHL games he played in the expansion year
- “Wt20+” are weighted Jr/Col+20 games: his prior games multiplied by the number of NHL games he played in the expansion year
[EDIT: I spent an inordinate amount of time creating and formatting tables for Part 1 and now for this. Then I realized afterward that it simply made more sense, and would provide a nice visual break, if I instead just screencapped my spreadsheets and posted those. They take up less space, it uses a different typeface, I can color-code the way I want, and so that’s what I’m switching to. And I feel like a dumbass for not having even thought of doing this sooner, since now I’ve spent hours wasting all sorts of time creating tables and there was simply no need.
So I cut the HTML for the five team tables here out and backed them up into a word processing file. 51 pages, single-spaced.)
1998-99 Nashville Predators

Quick analysis:
- A random forward from a random game would have played 212.88 NHL games, 194.53 other pro games, and 26.22 after-20 college/junior games before the 1998-99 season began.
- A random defenseman from a random game would have played 180.63 NHL games, 258.04 other pro games, and 21.56 after-20 college/junior games.
- The defensemen NHL experience is heavily skewed by JJ Daigneault, who had 775 games in the NHL. Even though he only played 35 games with the Predators, if he’s removed the average experience without him drops to 125 NHL games.
- Only three forwards had more than 300 games of NHL experience: Cliff Ronning (695), Darren Turcotte (586), and Tom Fitzgerald (569). Three defensemen also had 300 or more games: Daigneault (775), Rob Zettler (477), and Jay More (388).
- The four goalies who suited up in Year 1 had a combined total of 117 NHL games to their name when the season began, with Eric Fichaud accounting for 75 of them.
- Three players had played NHL games at age 18 or 19: Sergei Krivokrasov (13), Drake Berehowsky (8), and JJ Daigneault (67). None had playoff experience at that age.
1998-99 was notable for a couple reasons. It was the first expansion and expansion draft in five years, and it was the first under the 1995 CBA. I go into a decent amount of detail of why that’s important in Free Agency From 1995-2004 – The Group II Cold War.
If you don’t feel like reading all of that, the quick version is that the 1995 CBA established a system whereby compensation due to a team for loss of a restricted free agent followed a particular scale of draft picks, and teams received compensatory draft picks for losing unrestricted free agents. In the case of RFA compensation, draft picks transferred from the player’s new team to his old one. In the case of UFA compensatory picks, these were simply created by the league according to a scale that was based off of several factors.
What this ultimately meant for Nashville, and for the next three expansion teams (Atlanta, Columbus, and Minnesota), was that they had a vested interest in using expansion draft picks on pending UFAs who they would not be able to sign. They make the pick, and a few days later the player signs elsewhere for huge money. The expansion team would be the one who was considered the player’s old team, so they would get the compensatory pick. To prevent expansion teams from being absolutely ghastly in their first year while loading up on picks, the number of pending free agents they could select in their expansion draft was capped at six.
It also meant that a team who had exposed a pending free agent might prefer to keep the possible compensatory pick. The end result is that Nashville made a handful of trades, while the previous five expansion teams (San Jose, Ottawa, Tampa Bay, Anaheim, and Florida) had not.
1999-00 Atlanta Thrashers

Quick analysis:
- An average forward in an average game for Atlanta would have played 330.26 NHL games, 172.42 other pro games, and 30.56 post-20 college/junior games before the 1999-00 season began.
- An average defenseman in an average game would have played 218.41 NHL games, 180.98 other pro games, and 38.60 post-20 college/junior games before the 1999-00 season began.
- The Thrashers had five forwards with over 500 games of NHL experience: Ray Ferraro (1,020), Kelly Buchberger (795), Nelson Emerson (589), Mike Stapleton (583), and Johan Garpenlov (536).
- Among defensemen, only Gord Muphy (762) had played more than 500 NHL games. Darryl Shannon (461) and Chris Tamer (305) were the only others to top 200 NHL games.
- The only player with NHL experience at age 18 or 19 was Matt Johnson, who played 14 games with Los Angeles in 1994-95.
2000-01 Minnesota Wild

Instant analysis:
- An average Wild forward in an average game would have come into the season having played 155.71 NHL games, 221.85 other pro games, and 50.14 post-20 college/junior games in his career to that point.
- An average Wild defenseman in an average game would have come into the season having played 167.81 NHL games, 242.68 other pro games, and 28.56 post-20 college/junior games to that point.
- Only two players on the entire first-year roster had suited up for 400 NHL games; defensemen JJ Daigneault (898 games) and Curtis Leschyshyn (779). Daigneault would only play a single game with the Wild, and I own the jersey he wore during that game – which also happened to be the last of his NHL career.
- Four players on the first-year Wild had previously played NHL games at age 18 or 19: Matt Johnson (14), JJ Daigneault (67), Sergei Krivokrasov (13), and Curtis Leschyshyn (71). Each of Johnson, Daigneault, and Krivokrasov had played for an expansion team in the prior two years: Johnson with Atlanta, Daigneault and Krivokrasov with Nashville.
2000-01 Columbus Blue Jackets
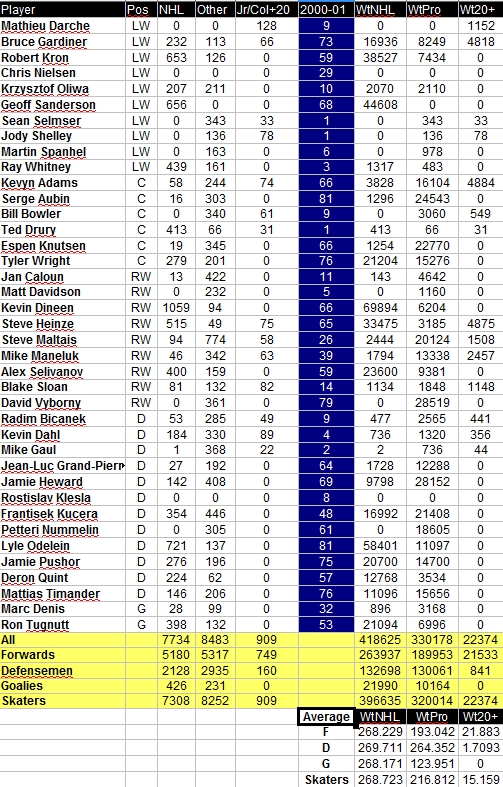
Instant analysis:
- An average forward in an average game for Columbus would have come into the 2000-01 season with 268.23 games of prior NHL experience, 193.04 games of other pro experience, and 21.88 post-20 college/junior experience.
- An average defenseman in an average game for Columbus would have come into the season with 269.71 games of NHL experience, 264.35 games of other pro experience, and 1.70 games of post-20 college/junior experience.
- An average goalie in an average game for Columbus would have come in with 268.17 games of prior NHL experience.
- This is an extremely unusual amount of balance in prior NHL experience: 268.23 for forwards, 269.71 for defensemen, 268.17 for goalies. The skaters come out to 268.72 prior games.
- The only player to have played NHL games at age 18 or 19 was Geoff Sanderson, who played 66 games across two seasons with Hartford and then added another 10 playoff games.
Assessment to this point
So far we’ve taken a brief glance at the nine expansion teams that took the NHL from 21 teams to 30. Let’s take a quick look at how the Class of ’97 teams stack up against each other in the average prior experience categories.
- NHL experience by forwards: 330.26 by Atlanta, 268.23 by Columbus, 212.88 by Nashville, 155.71 by Minnesota
- NHL experience by defensemen: 269.71 by Columbus, 218.41 by Atlanta, 180.63 by Nashville, 167.81 by Minnesota
- NHL experience by goalies: 268.17 by Columbus, 90.02 by Atlanta, 81.17 by Minnesota, 30.68 by Nashville
- Other pro experience by forwards: 221.85 by Minnesota, 194.53 by Nashville, 193.04 by Columbus, 173.42 by Atlanta
- Other pro experience by defensemen: 264.35 by Columbus, 258.04 by Nashville, 242.68 by Minnesota, 180.98 by Atlanta
- Other pro experience by goalies: 214.51 by Minnesota, 168.76 by Atlanta, 123.95 by Columbus, 106.76 by Nashville
- College/junior experience past 20 by forwards: 50.14 by Minnesota, 30.56 by Atlanta, 26.22 by Nashville, 21.88 by Columbus
- College/junior experience past 20 by defensemen: 38.60 by Atlanta, 28.56 by Minnesota, 21.56 by Nashville, 1.71 by Columbus
- College/junior experience past 20 by goalies: 31.59 by Atlanta, 15.24 by Nashville, 1.30 by Minnesota, 0 by Columbus
It’s interesting to note that Atlanta should have the best forward group: they have the most NHL experience and least other pro experience by a wide margin. Minnesota should have – by far – the worst; they’re the least experienced in the NHL, the most experience in other pro games, and by far had the most games played after 20 in college and junior hockey. Atlanta also had more NHL experience by defensemen and much less other pro experience, yet…Atlanta scored 170 goals and allowed 313, while Minnesota scored 168 and allowed just 210.
But this isn’t what we’re here for. We’re ultimately here for Vegas, and to see if the math can prove anything.
2017-18 Vegas Golden Knights
As I compile this and post it, Vegas and Columbus are playing on the night of January 23, 2018. The lineups for tonight have been loaded in, and the only chance is if Vegas backup goalie Malcolm Subban ends up playing.
Anyway, here’s the table of data to this point in the season.

Quick analysis:
- An average Vegas forward in an average game would have previous experience of 245.72 NHL games, 169.00 other pro games, and 15.70 college/junior games after age 20.
- An average Vegas defenseman in an average game would have previous experience of 235.79 NHL games, 178.94 other pro games, and 61.16 college/junior games after age 20.
- An average goalie would have 256.02 NHL games, 113.78 other pro games, and 5.48 junior/college games after age 20.
- The goaltending line is very heavily skewed by the fact that the five goalies that have dressed this season have 693 combined NHL games, with Marc-Andre Fleury accounting for 691 of them.
- Of the nine Vegas defensemen who have suited up this year, eight of them were playing college or junior hockey in their 20-year-old season and beyond. This is by far the highest number of defensemen to have done so of the last ten expansion teams, and as a percentage is incredibly high.
- Fleury has more career NHL regular season games than eight of the last nine teams‘ goalies had combined for in their expansion year. The only exception is the 1993-94 Florida Panthers, who had 725 NHL regular season games combined between Vanbiesbrouck (449), Fitzpatrick (146), and Reddick (130).
- Only four players played NHL games at age 18 or 19: David Perron (62 games), Stefan Matteau (17), Marc-Andre Fleury (21), and Luca Sbisa (39 plus 1 playoff game)
The next tables will show the comparisons between the ten most recent expansion teams, with Vegas’ data current through the game of 1/23/2018 (pending no goalie change).
Raw Numbers
These numbers are simply the combined amount of prior experience by all players who played so much as a single game with the expansion team in their first season. If a 1,000-game veteran played one game, the team gets 1,000 games added into their column. If a rookie plays all 82 games, it still counts for 0 in the column.
Raw numbers are useful insofar as determining overall experience that passed through the locker room, but I leaned more heavily on weighted numbers because of this obvious shortcoming.
Experience prior to expansion season – raw numbers (Forwards)
| Team | NHL games | Other Pro | Jr/Col+20 |
| 1999-00 Atlanta | 5602 | 4217 | 680 |
| 1991-92 San Jose | 5490 | 3909 | 1176 |
| 2000-01 Columbus | 5180 | 5317 | 749 |
| 1992-93 Tampa Bay | 4761 | 5213 | 1037 |
| 1993-94 Florida | 4478 | 3759 | 444 |
| 1992-93 Ottawa | 4245 | 3676 | 545 |
| 1998-99 Nashville | 3472 | 4470 | 798 |
| 2017-18 Vegas* | 3110* | 2963* | 287* |
| 2000-01 Minnesota | 2607 | 5363 | 1074 |
| 1993-94 Anaheim | 2446 | 3801 | 640 |
Experience prior to expansion season – raw numbers (Defensemen)
| Team | NHL games | Other Pro | Jr/Col+20 |
| 1993-94 Florida | 3218 | 2330 | 186 |
| 1992-93 Tampa Bay | 3142 | 1469 | 419 |
| 1998-99 Nashville | 2705 | 2982 | 337 |
| 1992-93 Ottawa | 2649 | 2550 | 389 |
| 2017-18 Vegas* | 2307* | 1331* | 542* |
| 2000-01 Minnesota | 2282 | 2464 | 431 |
| 1999-00 Atlanta | 2237 | 3003 | 485 |
| 2000-01 Columbus | 2128 | 2935 | 160 |
| 1991-92 San Jose | 1799 | 1542 | 418 |
| 1993-94 Anaheim | 1479 | 3111 | 328 |
Experience prior to expansion season – raw numbers (Goalies)
| Team | NHL games | Other Pro | Jr/Col+20 |
| 1993-94 Florida | 725 | 220 | 84 |
| 2017-18 Vegas* | 693* | 416* | 18* |
| 1992-93 Ottawa | 623 | 337 | 308 |
| 1999-00 Atlanta | 536 | 630 | 190 |
| 2000-01 Columbus | 426 | 231 | 0 |
| 1991-92 San Jose | 387 | 639 | 119 |
| 1993-94 Anaheim | 219 | 350 | 52 |
| 2000-01 Minnesota | 197 | 437 | 35 |
| 1992-93 Tampa Bay | 180 | 610 | 114 |
| 1998-99 Nashville | 117 | 283 | 75 |
Weighted Numbers
Weighted numbers are calculated by multiplying the number of prior games by the number of games that a player suited up for in the expansion year. If Player A has 1,000 games of prior experience and plays 4 games, it gets banked as 4,000 NHL games. If Player B had 500 games of prior experience and played 70 games, it gets banked as 35,000 NHL games.
This is more useful than the raw numbers more due to the fact that it tamps down the disproporionate impact of players who play only a handful of games, which is a fairly common occurrance for a first-year expansion team.
In the case of Vegas, they’ve only played 47 games to this point out of an 82-game season. The multiplier to determine overall pace is 1.74468.
Other factors to consider are that San Jose entered the league with an 80-game season. Tampa Bay, Ottawa, Florida, and Anaheim all entered the league with an 84-game season. Nashville, Atlanta, Columbus, Minnesota, and Vegas all entered the league with an 82-game season.
Experience prior to expansion season – weighted numbers (Forwards)
| Team | NHL games | Other Pro | Jr/Col+20 |
| 1999-00 Atlanta | 324980 | 170646 | 30071 |
| 2000-01 Columbus | 263937 | 189953 | 21533 |
| 1991-92 San Jose | 262578 | 99826 | 27321 |
| 1993-94 Florida | 259559 | 145742 | 15883 |
| 1992-93 Ottawa | 246728 | 157952 | 23624 |
| 1992-93 Tampa Bay | 217298 | 157916 | 31946 |
| 1998-99 Nashville | 209476 | 191422 | 25803 |
| 2000-01 Minnesota | 153220 | 218302 | 49338 |
| 1993-94 Anaheim | 142607 | 198244 | 30649 |
| 2017-18 Vegas* | 135635* | 93287* | 8665* |
Experience prior to expansion season – weighted numbers (Defensemen)
| Team | NHL games | Other Pro | Jr/Col+20 |
| 1993-94 Florida | 181952 | 51587 | 6093 |
| 1992-93 Tampa Bay | 173504 | 41079 | 13414 |
| 2000-01 Columbus | 132698 | 130061 | 841 |
| 1992-93 Ottawa | 118731 | 114070 | 24810 |
| 1999-00 Atlanta | 107456 | 89040 | 18991 |
| 1993-94 Anaheim | 105372 | 154639 | 11537 |
| 1991-92 San Jose | 93345 | 63318 | 13507 |
| 1998-99 Nashville | 88870 | 126957 | 10608 |
| 2000-01 Minnesota | 82562 | 119398 | 14051 |
| 2017-18 Vegas* | 65079* | 49388* | 16879* |
Experience prior to expansion season – weighted numbers (Goalies)
| Team | NHL games | Other Pro | Jr/Col+20 |
| 1993-94 Florida | 29941 | 1714 | 2203 |
| 2000-01 Columbus | 21990 | 10164 | 0 |
| 1992-93 Ottawa | 17423 | 14491 | 5663 |
| 2017-18 Vegas* | 11777* | 5234* | 252* |
| 1999-00 Atlanta | 7382 | 13838 | 2590 |
| 1993-94 Anaheim | 7020 | 8822 | 2704 |
| 2000-01 Minnesota | 6656 | 17590 | 107 |
| 1992-93 Tampa Bay | 5616 | 15844 | 1750 |
| 1991-92 San Jose | 4454 | 12922 | 521 |
| 1998-99 Nashville | 2516 | 8754 | 1250 |
Weighted Average Numbers
Weighted average numbers provide a cleaner comparison because it knocks down a handful of the other factors that skew the picture: number of games in the first season, plus the fact that Vegas shouldn’t shift too much from this and certainly not to the extent as the weighted numbers above.
Weighted average is simply the weighted number divided by the number of man-games played. 21 forwards have a combined weighted number of 325,000 prior NHL games, but only 12 forwards dress for a given game. 12 (number of dressed forwards) times 82 (number of games played) equals 984 man-games played by forwards. 325,000 (weighted number) divided by 984 (man-games) equals an average of 330.28 prior NHL games played by an average forward in an average game for our theoretical team.
Experience prior to expansion season – weighted average numbers (Forwards)
| Team | NHL games | Other Pro | Jr/Col+20 |
| 1999-00 Atlanta | 330.26 | 173.42 | 30.56 |
| 1991-92 San Jose | 273.52 | 103.99 | 28.46 |
| 2000-01 Columbus | 268.23 | 193.04 | 21.88 |
| 1993-94 Florida | 257.50 | 144.59 | 15.76 |
| 2017-18 Vegas* | 245.72* | 169.00* | 15.70* |
| 1992-93 Ottawa | 244.77 | 156.70 | 23.44 |
| 1992-93 Tampa Bay | 215.57 | 156.66 | 31.69 |
| 1998-99 Nashville | 212.88 | 194.54 | 26.22 |
| 2000-01 Minnesota | 155.71 | 221.85 | 50.14 |
| 1993-94 Anaheim | 141.48 | 196.67 | 30.41 |
Experience prior to expansion season – weighted average numbers (Defensemen)
| Team | NHL games | Other Pro | Jr/Col+20 |
| 1993-94 Florida | 361.02 | 102.36 | 12.09 |
| 1992-93 Tampa Bay | 344.25 | 81.51 | 26.62 |
| 2000-01 Columbus | 269.71 | 264.35 | 1.71 |
| 2017-18 Vegas* | 235.79* | 178.94* | 61.16* |
| 1992-93 Ottawa | 235.58 | 226.33 | 49.23 |
| 1999-00 Atlanta | 218.41 | 180.98 | 38.60 |
| 1993-94 Anaheim | 209.07 | 306.82 | 22.89 |
| 1991-92 San Jose | 194.47 | 131.91 | 28.14 |
| 1998-99 Nashville | 180.63 | 258.04 | 21.56 |
| 2000-01 Minnesota | 167.81 | 242.68 | 28.56 |
Experience prior to expansion season – weighted average numbers (Goalies)
| Team | NHL games | Other Pro | Jr/Col+20 |
| 1993-94 Florida | 356.44 | 20.41 | 26.23 |
| 2000-01 Columbus | 268.17 | 123.95 | 0 |
| 2017-18 Vegas* | 256.02* | 113.78* | 5.48* |
| 1992-93 Ottawa | 207.42 | 172.51 | 67.42* |
| 1999-00 Atlanta | 90.02 | 168.76 | 31.59 |
| 1993-94 Anaheim | 83.57 | 105.02 | 32.19 |
| 2000-01 Minnesota | 81.17 | 214.51 | 1.31 |
| 1992-93 Tampa Bay | 66.86 | 188.62 | 20.83 |
| 1991-92 San Jose | 55.68 | 161.53 | 6.51 |
| 1998-99 Nashville | 30.68 | 106.76 | 15.24 |
Overall analysis
A handful of things really jump off the page here.
First is that Atlanta had the most prior NHL experience among forwards by an enormous margin (330.26 games), with second-place San Jose well back (273.52). Yet the Thrashers finished 28th out of 28 teams in goals scored with 170, 24 goals back of the 27th-place Islanders.
Second is that Minnesota and Anaheim had by far the least prior NHL experience. Everyone else averaged at least 212 prior NHL games, but Anaheim had 141.48 games and Minnesota 155.71 games. Anaheim was 23rd out of 26 teams in goals scored, while Minnesota was 30th of 30 with just 168 goals on the season.
Third is that Florida had the most experience among defensemen and goalies by significant margins, and the first-year Panthers were 4th leaguewide in goals against while missing the playoffs by just one point. On the flip side was Anaheim, who was 6th in average goalie experience and 7th in average defensemen experience; they finished 8th leaguewide in goals against. There is a very obvious difference in the way these two teams were constructed right off the bat: Florida went heavy with experience and the best available goalie in John Vanbiesbrouck, and Anaheim went with younger players who needed an opportunity while shoring it up with a handful of experienced players. Florida made the playoffs in their third year and made it through to the Stanley Cup Final, while Anaheim stagnated until a minor surge in their fourth year. Ultimately the Panthers fell apart afterward after a bevy of ill-advised veteran player acquisitions at large dollar amounts, while the Ducks surged as their young high-end scoring (particularly Kariya and Selanne) carried them.
Fourth is that Minnesota went all-out with the idea that whoever they played in their first year was just a placeholder until younger and better replacements could be found. Adding an average forward plus an average defenseman plus an average goalie for Florida would produce a number of 974.96. Doing so for Minnesota would produce 404.69.
Vegas
What’s interesting is where exactly Vegas falls with the weighted average numbers, which provide the most clear picture of average experience. 5th/6th in average forward experience, 4th/5th in average defensemen experience, and 3rd in average goalie experience which is very heavily skewed by the fact that 691/693 career regular season games were played by one of the Golden Knights’ five goalies played to this point.
And yet what we’ve seen is a team that’s at the top of the conference and fighting for the top overall spot in the league. What exactly does this mean?
I come to three conclusions, which I believe are self-evidently true.
Gerard Gallant and the coaching staff have done an unbelievable job coaching this team. There aren’t any All-Stars on this squad, there aren’t any award winners, there are hardly any players who are truly missed by their old teams. Almost no existing team sat up in late June and said, “Damn, we’re really going to miss this guy and we’ll have to actively seek someone who replaces what he brings.” There are expansion draft selections, there are guys acquired in side trades, there are waiver claims, there are free agent signings. And look where this team, cobbled together in great haste, is currently standing.
The scouting staff has been unreal. Players who were thought to be career minor leaguers have turned into valued contributors. A goalie claimed off waivers in the preseason (Malcolm Subban) is currently 11-2-1, and a goalie who was thought to be done as a future NHL player (Oscar Dansk) is 3-0-0 and has the first shutout in franchise history. This doesn’t even begin to scratch the surface of what the scouts were able to find.
The number of NHL-caliber players vastly exceeds what anyone previously thought. Coming into expansion, there were concerns over “a diluted talent base” that I dismissed as ridiculous. My opinion was that the NHL as a league could go to 32 teams without there being a noticeable drop in talent. By November I thought that 34 teams could be doable without a drop. Now I’ll say 36.
Fact: Vegas has dressed nine defensemen this year, eight of whom played college or junior games in their 20-year-old season or beyond. This is a historically high number, and the idea that a number that usually is an indicator of someone who will not be a longtime NHLer is so decisively being stood on its head is extremely unusual.
On the last ten expansion teams, spanning 27 NHL seasons, there have been a total of five players who had more than 140 games played at the junior or college level in their age 20 season or later: Antti Laaksonen (154 games), Mike Matteucci (142), Rob Valicevic (157), and Mark Mowers (144). There is a fifth one this year: Brad Hunt (150).
Matteucci played in the SJHL until shortly after his 20th birthday, and followed that with four years at Lake Superior State. As a senior he was named the best defensive defenseman in the CCHA. By the time the Minnesota Wild signed him, he was 28 years old and had no NHL games to his credit. He would ultimately play six games in the NHL before retiring a few years later, having spent most of his pro career split between the IHL and AHL.
Mowers was 19 when he played a year in the USHL, then followed that with four years at New Hampshire. By the time he graduated, he’d been named team captain, named first-team All-American, and was a Hobey Baker finalist. Nashville signed him as a college free agent, age 24. He played 30 games with Nashville in their first year, registering 0 goals and 6 assists. He would ultimately play three full NHL seasons and parts of others, totaling 278 games.
Valicevic was 20 years old and had been drafted by the Islanders when he went off to Lake Superior State, where he was teammates with Matteucci for three of his four years there. He was 27 and had no NHL games when Nashville came calling, and he would eventually play 193 NHL games.
Laaksonen was almost 20 when he was stuck in lower-division hockey in Finland and decided to see what an American college experience could do for him. He played four years at Denver, and was drafted by Boston shortly after graduating. He had 38 NHL, 144 AHL, and 15 ECHL games when the Wild picked him up for their first season.
Hunt, meanwhile, was 20 when he went to Bemidji State. He went from graduation to the AHL, and played part of that season and the entire next year in that league. The next year he signed with Edmonton, and over the next four seasons would play 33 NHL games against 208 AHL games. When Vegas picked him up before this season, he was 29 years old and seemed to have pretty clearly shown that he was not an NHL player. After all, 29-year-old 5’9″ defensemen who play 33 NHL games across three teams in six pro seasons and have 150 games of college/junior experience in their 20-year-old season and beyond do not go on to have meaningful NHL careers.
And yet we see that, at least in this case, that the top team in the NHL has great need of such a player.
But Hunt is not the only one who’s benefited.
Only a handful of players resembled known assets, basically four forwards (Marchessault, Perron, Neal, and Smith) and a goalie (Fleury). Everyone else was a question mark. Among the biggest surprises:
William Karlsson has 27 goals and 42 points in 48 games. Karlsson had 18 goals and 50 points in 183 prior NHL games. The biggest difference, though, is that Karlsson averaged a bit over 13:30 of ice time a night with Columbus and Anaheim, and is currently at 18:21 in Vegas.
Erik Haula has set career highs in goals (17) and points (35) with just 44 games played this season. His ice time so far is 17:44 a night compared to a career average of 12:25, and he’s getting power play time for the first time in his career.
Colin Miller had 9 goals and 29 points in 103 NHL games coming into this season. He’s at 7 goals and 26 points so far, and his average ice time of 18:51 is well over his career average of 15:49.
Nate Schmidt has tied a career high with 3 goals and has set a career high with 21 points. He’s averaging 22:26 a night, with previous career highs of 18:04 and 18:42 a night.
Shea Theodore has a career high in goals (4) and points (17) while averaging 19:47 a night against a career average of 17:57.
Deryk Engelland, a 35-year-old defenseman who didn’t become an NHL regular until he was 28, is one point short of his career high in a season. His 19:46 a night is easily a career high, and is well over his career average of 15:09 and his previous season high of 18:20.
Theodore, a highly-touted defenseman and a recent 1st-round pick, is not truly unexpected as far as how he’s played. But the others?
What we’ve seen over the previous nine expansion teams are as follows:
- A handful of known commodities who can play at the NHL level
- A handful of players who are little more than filler in the NHL and will be gone soon enough
- A lot of unknowns who are forced into unfamiliar positions, like career third-liners and third-pairing defensemen playing up on the first line or first pairing
This is the same pattern that we saw with Vegas. I think it’s safe to say that Jonathan Marchessault isn’t that big of a surprise, but then again he’s had one good year in the NHL and before that had played 49 games with 8 goals and 19 points. David Perron hitting 41 points in 42 games isn’t that much of a surprise, but then again he’s scoring at a pace that is by far a career high and he last hit 50 points in 2013-14. Reilly Smith isn’t that much of a surprise, but he did slump last year and there were questions about whether he was a flash in the pan. Marc-Andre Fleury isn’t that much of a surprise, but he’s had a Cup contender in front of him for the better part of the last decade and he was going to a patchwork expansion team as the unquestioned #1 goalie.
Even if we take out Theodore, there are still four huge surprises above. But they’re not the only ones.
Vegas has dressed nine defensemen this year. Their combined totals in the NHL one year ago were 22 goals and 71 assists, good for 93 points. The defensemen this year have 22 goals and 93 assists for 115 points. And we’re only at the All-Star break. There are still 34 games left to play this season.
Vegas has dressed sixteen forwards this year. Their combined totals in the NHL one year ago were 131 goals and 150 assists, good for 281 points. This season they’ve accounted for a combined 140 goals and 175 assists, good for 315 points. Again, that’s with 34 games left to play in the regular season this year.
All skaters combined last year had 153 goals in the NHL and 246 assists, which is 399 total points. That’s in an 82-game season (4.866 per game). If this held true, we’d expect the players to at this point have a combined 90 goals and 144 assists, or 233 points. Instead, what we see is this year, after 48 games, it’s 162 goals and 268 assists, good for 430 points (8.958 per game).
“But wait,” you may say. “Offense isn’t everything. And it’s also not reasonable to simply assume that players being given a chance are going to simply stagnate in terms of offense and not produce more than they were.”
True, offense isn’t everything. Vegas has allowed the fifth-fewest goals in the NHL at this point. There isn’t truly a good way to measure defensive output, but the fact that an unheralded free agent goalie signing with less than 50 games of North American pro experience is 3-0-0 with a shutout may say something. And if that doesn’t, the fact that a preseason waiver claim is carrying a 2.49 GAA and .914 save percentage (with an 11-2-1 record) may say something more. And the fact that a 33-year-old goalie in Fleury has a 1.77 GAA and a .942 save percentage says even more.
But then the question is how much we would expect to see an expansion team’s offensive output improve on a year-to-year basis.
(I swear I was hoping to have this all wrapped up a while ago, but this is how I write and research. One loose thread forms, and I have to pull on it instead of just cutting off. If two more loose threads pop up, so be it. I was ready to post this at 2,800 words, and now I’m almost double that.)
In order to find this out, I went back through the last nine expansion teams and compiled all of the year-to-year offensive totals and compared them. Then I went out to pick up dinner, and realized that I wasn’t doing a true comparison. For example, I took every player from the 1991-92 Sharks and compiled their offensive totals from that year, but also those players’ 1990-91 overall totals. It showed a surprising surge, with those players going from 163 total goals and 278 assists (441 points) in 1990-91 to 219 goals and 344 points (563 points) in 1991-92. In fact, every single one of the last ten expansion teams – this year’s Vegas team included – showed similar massive surges.
Intuitively it didn’t seem right, but I didn’t realize it until I went to pick up dinner. In fairness to me, this was only a few minutes after I finished the last combined stats and I likely would have realized my error pretty quickly. Anyway, to use San Jose as the example, they dressed 45 different skaters in 1991-92. But a lot of those guys – 16, in fact – had not played a single NHL game in 1990-91. Five of them weren’t in the NHL at all but had previous NHL experience: Jayson More, Link Gaetz, Peter Lappin, Mark Pavelich, and Brian Lawton. The other eleven had never played an NHL game before: David Williams, Claudio Scremin, Michael Colman, Jeff Odgers, Pat Falloon, Ed Courtenay, Ray Whitney, Mike Sullivan, J-F Quintin, Dale Craigwell, and Mikhail Kravets.
In comparing just the remaining 29 players who played for the Sharks in 1991-92 and had played NHL games in 1990-91, the combined totals shifted from 163-278-441 down to 143-213-356. The 16 players who were not in the NHL at all in 1990-91 accounted for 76 of the Sharks’ 219 goals, 131 of the 344 total assists, and 207 of the 563 total points.
San Jose is the only team to have their first-year players combine for fewer goals, assists, and points than they had registered the year prior. The only other team to suffer a decline in any category was the 2000-01 Columbus Blue Jackets, who went from 235 combined assists in 1999-00 to 212 in 2000-01 and from 380 combined points down to 365. Nine teams increased their goal totals, eight teams their assist totals, and eight teams their point totals. The actual range varies widely, from Anaheim’s +91 in goals and +103 in assists down to Columbus’ +8 in goals and Florida’s and Nashville’s +50 in assists.
What’s interesting is the sheer volume of actual NHL players that expansion teams have had. Generally speaking, a large roster size in a given year is an indication of a poor-quality team as they continually cycle players in and out of the lineup and up and down from the minors, although there certainly exceptions. It’s uncommon for a team to get hit hard with injuries to the extent that they end up in the same boat, although it does happen. 2016-17 Pittsburgh is a good example. Generally speaking, good teams do not dress 35 skaters in a season and still have success. This trend has shifted as the league has gotten further away from the implementation of the salary cap, and as teams look to save a few bucks on the cap by churning through callups.
Of the nine expansion teams before Vegas, the smallest in-season roster size for skaters is 31 by 1993-94 Anaheim. The largest is 40, set by 1992-93 Tampa Bay. Looked at by experience, however, it’s a different story.
I’m going to be perfectly honest here. I make use of tables for various reasons, mostly because it’s an easy way to get valuable information into a condensed area without reading a wall of text. But the sheer volume of tables in this and in Part I has become tiresome, so instead I’m simply going to screenshot the spreadsheet from which the table is derived. It’s actually not what my spreadsheet looks like, in the sense that I don’t actually color-code anything. I’m not sure why I don’t, but I don’t. I only did so in this case to make it easier for everyone reading this.
For the purposes of this table, “Rookie” means someone who has never played an NHL regular season game before the expansion year; it does not necessarily mean that a player was eligible for Calder Trophy consideration. “Not in NHL” is someone who had previously played in the NHL, even for a single game, but did not play NHL games in the year immediately preceding the expansion year.
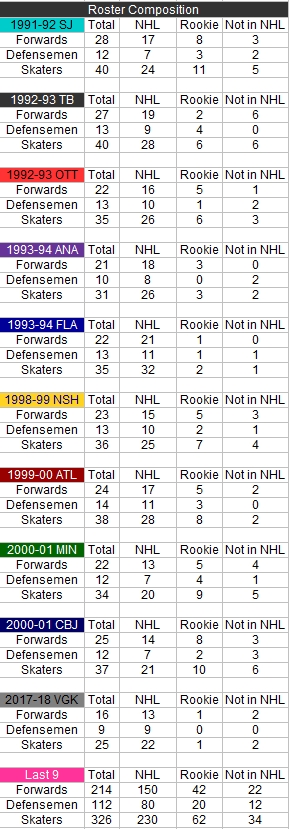
It’s interesting to note that of the ten expansion teams in their first year, seven of them dressed their 1st-round pick for even a single game: San Jose with Pat Falloon, Tampa Bay with Roman Hamrlik, Florida with Rob Niedermayer, Nashville with David Legwand, Atlanta with Patrik Stefan, Minnesota with Marian Gaborik, and Columbus with Rostislav Klesla. Both Klesla and Legwand were sent back to the OHL before reaching the minimum number of games to begin their contracts, so only five were actually up for the whole season. Ottawa did not have Alexei Yashin in the lineup in 1992-93, Anaheim did not have Paul Kariya in 1993-94, and Vegas will not have one of their three 1st-rounders in 2017-18.
I do not believe that there is a correlation (for 1st-rounders) between being in the lineup in that first year and failing to develop into a top-level star. I don’t think that another year of college hockey and international experience helped Kariya, and another year in Russia likely did not help Yashin. Gaborik was unharmed by being in the lineup, and it would certainly be a stretch to say that one game played that first year ruined Legwand or that eight games took a toll on Klesla. It’s simply an absurd argument to make.
It’s from the ranks of “not in NHL” that we can see the various reclamation projects. Of note:
- Brian Lawton spent 1990-91 in the IHL after a brief and largely disappointing NHL career. He played 59 games with San Jose in 1991-92, coming close to career highs with 15 goals, 22 assists, and 37 points.
- John Tucker played in 78 games with Tampa Bay in 1992-93 after spending the previous year in Italy. He had 17 goals to go with a career-high 39 assists, and his 56 points was the second-highest total of his career.
- Chris Kontos had a dizzying four years before catching on with Tampa Bay in 1992-93. He played a full season in Switzerland in 1988-89, then played seven regular season games and eleven playoff games with Los Angeles. He scored 9 goals and 0 assists in those playoff games. This was followed by six NHL games in 1989-90, with the rest of the time in the AHL. 1990-91 was spent entirely in the IHL, and then in 1991-92 he split time between the Canadian National Team and a squad in Italy. Brought back to the NHL with first-year Tampa Bay in 1992-93, he had 27 goals and 51 points in just 66 games. Kontos still holds the Kings’ record for most goals in a playoff series, with 8 against Edmonton in 1988-89.
- Patric Kjellberg played just seven (scoreless) NHL games in 1992-93 before heading back to Sweden, where he played the next five seasons. Nashville signed him in 1998-99, and he played 71 games while producing 11 goals with 20 assists. He played two more full seasons and part of another with the Predators before being traded to Anaheim.
- Tomas Vokoun hadn’t played an NHL game in two years, and his career line to that point consisted of playing one period of one game with Montreal and allowing 4 goals on 14 shots. That’s a .714 save percentage and a 12.00 GAA if you’re keeping track at home. Nashville drafted him as part of a side deal in the 1998 Expansion Draft. Anyone who says that they foresaw Vokoun eventually playing a total of 700 NHL games with 300 wins is a liar, but that’s what he did.
- Wes Walz had played the preceding four years in Switzerland before Minnesota signed him for 2000-01, and he responded by setting a new career high with 18 goals. Walz would eventally play seven seasons in all with the wild.
- Espen Knutsen had just nineteen NHL games to his name and was a mainstay overseas when Columbus signed him for their first season. He responded by putting up 11 goals and 42 assists, good for 53 points, in just 66 games.
What we have not seen in Vegas is any such reclamation project, as only two players dressed so far – Brandon Leipsic and Stefan Matteau – did not play NHL games in 2016-17. But then, we didn’t see these types of reclamation projects with Atlanta, Florida, Anaheim, or Ottawa either.
Next we look at a different type of reclamation project, where players on a first-year team have a surge that no one could have seen in light of their recent history.
- David Bruce was a terrific scorer in the minors who never did much in his various callups to the NHL. In 1989-90 and 1990-91 in the IHL, he scored 104 goals and 87 assists, or 191 points. This was followed by 23 goals and 37 points in just 24 playoff games. But in his NHL career to date, he’d accounted for just 24 goals and 44 points in 155 carere games. Given the chance to perform with San Jose in 1991-92, he had 22 goals and 16 assists for 38 points in just 60 games.
- Rob Zamuner was a 3rd-round pick of the Rangers in 1989, and had three years of being a point-a-game scorer in the minors. When Tampa Bay signed him off the street in 1992-93, he’d appeared in just nine games, with one goal and two assists, in his NHL career. That year with the Lightning, he appeared in all 84 games, putting up 15 goals and 43 points. Over time, he transitioned toward more of a defensive role as the league changed around him. By the time he was done, he’d played 798 NHL games and represented Canada in the 1998 Olympics.
- Shawn Chambers had missed extensive time in 1990-91 and 1991-92 due to a knee injury that required nearly-daily draining, to the point where the Capitals team that had paid a heavy price to acquire him in trade left him exposed in the 1992 Expansion Draft. Despite having only played seven total pro games the previous year, Chambers put up 10 goals and 29 assists (39 points) in just 55 games. He would play two full and one partial season with the Lightning before being traded to New Jersey in 1995, where he provided a serious boost to the Stanley Cup champions. Not bad for a guy whose overall rating in NHLPA 93 was a 1.
- Bob Beers had played 50 NHL games the previous three seasons with Boston, registering no goals and just seven assists. With Tampa Bay in 1992-93, he had 12 goals and 36 points in 64 games.
- Rob DiMaio had played in 74 NHL games across the previous four seasons with the Islanders, putting up just six goals and two assists, when Tampa Bay picked him up in the 1992 Expansion Draft. Given a more regular role, he played in 54 games while chalking up nine goals and fifteen assists. DiMaio would play untl the end of the 2005-06 season, appearing in 894 NHL games by the time he was done.
- Perhaps the gold standard of resurrected careers is Brian Bradley, who had shown he could score in the NHL if given ice time and the chance. In 323 games to date, he had 71 goals and 203 total points, but between 1990-91 and 1991-92, it was 129 games and just 21 goals and 73 points. Toronto left him exposed in the Expansion Draft, and Tampa Bay was happy to take him. In that first year, he put up 42 goals and 86 points in 80 games. Concussions would end his time with the Lightning prematurely, but in four full and two partial seasons he had 111 goals and 300 points in 328 games.
- Jamie Baker had 9 goals and 19 points in 71 career NHL games with Quebec, where he was unable to secure a regular spot despite some truly awful teams. He was 26 and pretty much done in the NHL until expansion added another chance. With Ottawa in 1992-93, he scored 19 goals and added 29 assists in 76 games. The next year with San Jose, he scored a goal that Detroit fans undoubtedly are very upset with me for mentioning.
- Bob Corkum had 96 NHL games with 10 goals and 8 assists when Anaheim picked him up in the Expansion Draft. I don’t know what their expectations were for him, but somehow I think that 23 goals and 51 points in 68 games exceeded them by quite a bit.
- Garry Valk was used mostly as a grinder with Vancouver over the previous three seasons, where in 172 games he scored just 24 goals and 35 assists. With Anaheim in 1993-94, he netted 18 goals and 27 assists in 78 games.
- Bill Houlder had spent parts of the last six seasons in the NHL, but in 111 games he accounted for just 6 goals and 29 points. He could score, quite prolifically in fact, in the minors but not so much in the NHL. With Anaheim in their first year, he played in 80 games and put up 14 goals and 25 assists. By the time he retired, he’d played 846 NHL games.
- Jesse Belanger was a prolific scorer in juniors, but was undrafted. Signed as a free agent after his overage season by Montreal, he proved to be a prolific minor league scorer. But in limited NHL duty – 23 games, 4 goals, 2 assists (6 points) – across two seasons, it hadn’t carried over. Florida claimed him in the Expansion Draft, and he had 17 goals and 33 assists (50 points) in 70 games with the first-year Panthers. (Florida had many other lesser reclamation projects, where players who’d slumped in 1992-93 suddenly re-found their game in 1993-94.)
- In 125 games over the previous two seasons with Chicago, Sergei Krivokrasov scored 23 goals and 24 assists (47 points). It took him just 70 games with the first-year Predators to pot 25 goals to go with 23 assists (48 points).
- Sebastien Bordeleau could score at all levels except the NHL. In 85 career games to that point, he accounted for just 8 goals and 17 assists (25 points). Then with Nashville in 1998-99, he put up 16 goals and 24 assists (40 points) in 72 games.
- Vancouver didn’t know what to do with Scott Walker, whether to keep him as a defenseman or to remake him as a fourth-line scrappy forward. Whatever he was, in 197 games he accounted for 10 goals and 34 assists (44 points). Taken in the Expansion Draft by Nashville and given a defined role, he scored 15 goals and 25 assists (40 points) in 71 games. By the time he retired in 2010, he’d played in 829 NHL games.
- One of the top scorers of the 1990s, Geoff Sanderson had tailed off badly following Hartford’s move to Carolina. Across 1997-98, 1998-99, and 1999-00, Sanderson played in 217 games and accounted for just 36 goals and 49 assists (85 points). For a guy who’d scored 40 goals twice and 30 goals twice more, it was quite a drop. Sanderson was taken by Columbus in the 2000 Expansion Draft, with Buffalo throwing in additional pieces (two picks and two prospects) just to be rid of him. In the Blue Jackets’ first year, Sanderson re-found his touch and scored 30 goals plus 26 assists (56 points) in just 68 games.
- Although it’s too early in general, I think we can safely say that no one saw William Karlsson‘s career 18 goals and 32 assists (50 points) in 183 games suddenly blossoming into 27 goals and 15 assists (42 points) in 48 games with Vegas. Several more players will be added to this list.
And the big first-time NHLer:
- Lubomir Sekeras was soon to be 32 years old when he came over to play in 2000-01 with the Minnesota Wild. As an overage NHL rookie, which usually is not a recipe for success, he scored 11 goals and 23 assists (34 points) from the blueline and was just five points short of the team lead for the season.
What’s interesting is that – generally speaking – there’s a correlation between unexpectedly successful players and the actual success of the team on the ice. The biggest exception was Florida in 1993-94, simply because they went so heavily on experienced and proven NHL players that there wasn’t necessarily a need to step out and acquire longshots who might be able to succeed.
By my count, Tampa Bay in 1992-93 had seven players who were unexpectedly successful: Chambers, Beers, DiMaio, Tucker, Kontos, Bradley, Zamuner. Their 53 points in a very competitive division dwarfed expansion brother Ottawa, who boasted a lone such player (Jamie Baker) en route to a 10-70-4 record.
Anaheim had three: Valk, Corkum, and Houlder. Florida had Belanger, and a handful who produced at a higher level than previously but not to the same extent as the other players spotlighted here.
Nashville had four with Kjellberg, Walker, Krivokrasov, and Bordeleau. Vokoun and Kimmo Timonen were also part of the team in the first year, but weren’t really breaking through at that point.
Atlanta had none, which may explain how they had 14 wins in an 82-game first season.
Columbus had two with Knutsen and Sanderson, and Minnesota had Sekeras and Walz. Both teams managed to avoid being in the bottom five of the league standings in their first year.
Vegas currently has Karlsson, but undoubtedly will have more.
How do these breakthroughs actually show up? In the scoresheets, mostly.
To read this next spreadsheet/table, here is how the four columns are broken down.
- The far left (“Offense by expansion players in previous year”) is the combined offensive output of all players on a first-year expansion team in the last season before that team came into existence. For the 1991-92 Sharks, that’s the 1990-91 season. For the 1998-99 Predators, it’s 1997-98.
- The next one (“Total offense in expansion year”) is the total offensive output of the expansion team in its first year of existence.
- The second one from the right (“Offense in expansion year by returning players”) is just the expansion-year output by players who suited up in at least one NHL game the previous year.
- The far right (“Offense in expansion year by new players”) is the expansion-year output by players who did not play any NHL games the previous year.
- The percentages in blue boxes represent, in order, the increase in goals, assists, and points by the players who both suited up for an expansion team in its first year and played NHL games the previous year.
The bottom row is the nine teams that entered the NHL between 1991-92 and 2000-01; Vegas is excluded from these totals.
The Vegas totals in the third column are as they are now, at the All-Star break in 2018. The totals immediately to the right of that (fourth column) are the totals if the same pace holds true over the rest of the season.

So now we finally have an answer to the question. Of the nine teams that entered in the ten seasons from 1991-92 and 2000-01, there is a roughly 20% increase in the total number of goals scored by players on a first-year expansion team compared to what they collectively managed the previous year in the NHL.
There are, of course, a couple of issues.
- If a player suited up for a single NHL game in the previous year, he’s counted as a returning player for the purposes of this and everything that he produced gets tallied. It goes the other way too: if he played a single game for a first-year team, he shows up on their roster. Normally this isn’t too much of a problem, but there’s one example that makes the issue clear. Anaheim in 1993-94 acquired Stephan Lebeau from Montreal, and he played 22 games with the Ducks down the stretch that year. He also played a full year with Montreal the year prior (1992-93), where he tallied 31 goals and 49 assists (80 points). Since he played in the NHL the year prior, his 6 goals and 4 assists in 22 games with the Ducks look like a massive slump in production. To go from 31-49-80 down to 6-4-10 would be a historic drop in production.
- Regardless, it has a large impact on Anaheim’s numbers. If we simply remove Lebeau from both 1992-93 and 1993-94, Anaheim’s goal scoring increase goes from 40.99% to 53.7%, assists from 30.38% to 44.18%, and points from 34.58% to 47.91%. Lebeau by himself accounts for roughly a 2% shift in the NHL’s nine-team average.
- That said, this is a very uncommon situation and there are other examples that offset it. There are several players who simply had a nagging minor injury or a slump in the year before they caught on with an expansion team, and it “shows” that they had a surge in production in that first year when in reality it was simply a return to form.
It’s not a perfect system by any means, but short of going ten levels deep into all sorts of adjustments and other factors, it’s what we’ll have to deal with for now.
Of the nine expansion teams considered for the overall averages, we see a 20.3% jump in goals, 16.46% jump in assists, and 17.93% jump in overall points by returning players. Three teams – San Jose, Florida, and Columbus – drag this down. The other six teams all saw jumps that exceed these averages, while those three all fall below in each of the three categories. Without those three teams, the increases go to 30.91% in goals, 26.36% in assists, and 28.06% in points. These are large numbers.
Of course, that’s not really how this works. Without diving even further into this, there’s no way to simply go wiping players like Lebeau out of existence or removing entire teams from history for the sake of playing with numbers.
What does this all mean for Vegas, as it pertains to their first-year team?
1) The Golden Knights’ players’ combined offense in 2016-17 was 153 goals and 221 assists (374 points). Of the ten expansion teams since 1991-92, this puts them 3rd in prior year’s goals, 7th in prior year’s assists, and 4th in prior year’s points. Florida’s first-year team outscored Vegas by 55 goals (35.95%) and 137 points (36.63%).
2) That said, the years in question were dramatically different in terms of total offense leaguewide. Florida’s prior year (1992-93) was in a league where there were 7.25 total goals scored in an average NHL game; Vegas’ prior year (2016-17) was in a league where there were 5.53 total goals scored in an average game.
3) However, 1992-93’s leaguewide surge in offense was largely driven by having two putrid (San Jose and Ottawa) and one middling (Tampa Bay) expansion team, plus Hartford and Edmonton teams that were mediocre as well. Edmonton, the 20th-place team, was 19 points out of 19th place. Power plays were way up, and so too were power play goals.
4) Florida’s prior year players scored 208 goals in a league with 7.25 total goals, so their players accounted for the equivalent of all goals scored in 28.69 games. Vegas’ prior year players scored 153 goals in a league with 5.53 total goals, so their players accounted for the equivalent of all goals scored in 27.67 games. It’s a lot closer, but Florida relative to its era still produced more offense than Vegas did in its prior year.
Doing the same thing, we can “see” the same thing for other expansion teams.
- San Jose’s players scored 163 goals in a prior year with 6.91 total goals per game (23.59 games worth of goals)
- Tampa Bay’s players scored 145 goals in a prior year with 6.96 total goals per game (20.83 games worth of goals)
- Ottawa’s players scored 106 goals in a prior year with 6.96 total goals per game (15.23 games worth of goals)
- Florida’s players scored 208 goals in a prior year with 7.25 total goals per game (28.69 games worth of goals)
- Anaheim’s players scored 131 goals in a prior year with 7.25 total goals per game (18.07 games worth of goals) – 100 goals and 13.79 games without Lebeau
- Nashville’s players scored 124 goals in a prior year with 5.28 total goals per game (23.48 games worth of goals)
- Atlanta’s players scored 111 goals in a prior year with 5.27 total goals per game (21.06 games worth of goals)
- Columbus’ players scored 145 goals in a prior year with 5.49 total goals per game (26.41 games worth of goals)
- Minnesota’s players scored 76 goals in a prior year with 5.49 total goals per game (13.84 games worth of goals)
- Vegas’ players scored 153 goals in a prior NHL year with 5.53 total goals per game (27.67 games worth of goals)
These don’t really translate well to points in the standings. Yes, the three teams with higher numbers compared to their same-year brothers all finished higher in the standings. But that’s about the extent of it.
Final conclusions
Here is what everything ultimately boils down to.
I looked quite extensively at whether Vegas has benefited from having a more experienced first-year roster at their disposal than the nine most recent teams have had. My analysis shows that the argument that they have a more experienced roster is a false one. Yes, they have the most experienced goalie in recent expansion history with Marc-Andre Fleury, but he’s played just 18 of 48 games to this point and his backups have proven to be NHL-caliber as well.
I looked at whether Vegas’ roster construction as it pertains to recent NHL experience – specifically through the lens of whether their players were even in the NHL a year ago – has benefited them to an extent that the other nine teams did not have. My analysis shows that this is not the case.
I looked at whether we can “see” through college and junior games played in an age 20 season and later – a measure that normally negatively correlates to the likelihood of a player having a meaningful NHL career – exactly how much Vegas has benefited while other previous expansion teams were screwed. My analysis determined that the opposite was in fact true: a measure that normally shows a lesser player is found all over the Vegas defensemen who anchor a defense that at this point has allowed the 5th-fewest goals in the league.
I looked at whether Vegas’ first-year roster is loaded with scorers to an extent that previous teams could not be. My analysis shows that although Vegas is near the top of prior year scorers, they’re not at the top and they’re not removed far enough from the next-closest teams to be able to accuse them of benefiting from a stacked system.
I looked at whether Vegas has successfully increased their scoring compared to the prior year in a way that previous teams could not hope to. My analysis shows that although they are currently on pace to register the largest prior year to expansion year offensive increase in recent NHL history, it wouldn’t be by an enormous margin. At this point, they’re on pace for a 43.67% increase, which is a bit above the 41.11% of 1992-93 Ottawa and the 40.99% of 1993-94 Anaheim. There’s also the chance that the pace falls off and they don’t even finish ahead of those two teams.
Here is reality: the coaching has been terrific. The scouting that recommended this team and the front office that assembled it has been terrific.
But what’s the ultimate conclusion that we can take away from this? It’s that there is a lot more NHL-caliber talent that is out there and not on NHL rosters than any of us could have fathomed.
There’s a general assumption that the top players in the world all play in the NHL, and that the best player in a non-NHL league is worse than the worst player in the NHL. It’s just a dumb argument to make, and there are hundreds if not thousands of examples of players who very clearly disprove it. Sidney Crosby as a 17-year-old was one of the 100 best hockey players in the world even if he was playing in the QMHL, and Alex Ovechkin one of the 100 best at that age even if it was in the old Russian Superleague
But although expansion teams aren’t starting off with these guys, they’re still culling talent out of other leagues and the players become established as NHLers. One would have to be a pretty hardcore fan of hockey to have even heard of Lubomir Sekeras before 2000, but he was able to produce in all facets of the game on a first-year expansion team.
What’s different in Vegas is that the Golden Knights have not been forced to slog through various other leagues in order to fill out a roster. To be honest, I’m fine with that. I don’t think that a first-year team should have to assemble everything in short order while also looking to see if there’s a player in the Swedish second division who might be able to provide 15 goals while anchoring the third line.
But why? The existing teams that were hardest hit are still doing perfectly fine. Columbus lost William Karlsson, who’s currently sitting 2nd in the NHL in goals scored; they’re second in their division. Nashville lost James Neal, who has 22 goals currently and was on the Predators’ top line; they have the fourth-highest point percentage in the NHL. Florida lost their leading goal scorer from a year ago; they’re on pace for the same number of points as then. Minnesota lost a top prospect and a valuable forward; they’re 8 games over .500 at the break.
Yes, this argument rankles some. Fans of San Jose, Ottawa, and Tampa Bay justifiably have a beef with the way that the NHL allowed the established teams to stack the deck in their own favor even if it meant that the new teams suffered immensely. Fans of Atlanta, Nashville, Columbus, and Minnesota may justifiably be annoyed watching a new team rip through their schedule while they all had to deal with 5-1 losses and watching a career third-liner try to hang on while playing 21 minutes a night. And all three of Nashville, Columbus, and Minnesota may have the double argument of watching their team lose a valuable player in the expansion draft when no such opportunity existed during their expansion process. These are all legitimate points.
The NHL, and the world of hockey as a whole, has benefited from an enormous growth in the game and in the number of players over the last two decades. I wrote on “Talent Dilution” a couple years ago and was shocked to see the exact extent to which the game has grown all over the world – including in “traditional hockey countries”. That’s what this is really all about.
But what we’re seeing in Vegas is not necessarily a new normal. It’s an incredible convergence of a front office and a scouting staff that assembled a team out of spare parts and have seen that take off under the guidance of a coaching staff that didn’t even begin to be assembled until nine months ago. I doubt very much that the next expansion team will have anywhere close to this first season for various reasons.
But it’ll be fun to see if they can.
