PREVIOUS: Part 6 (Hartman’s Equation, and Common Sense)
If talent dilution exists, we would see some visible evidence all over the standings sheet. Since expansion teams normally bring up the bottom of the standings in their first few years of their existence, there must be some type of peripheral effect that ripples throughout the league. If that happens, we’ll find the evidence.
The Dirty Dozen and a Baker’s Dozen More
Setting aside the earliest years of expansion, and focusing exclusively on the moder era (1967-present), there are twenty-five teams that have been added to the NHL via expansion. One could make the argument that it’s actually twenty-six based on how one classifies the Oakland Seals/Cleveland Barons and the San Jose Sharks, but no matter: there are thirty-one teams currently, and only six of them existed before the 1967-68 season. No point in splitting hairs any further than that.
In 1967-68, the NHL doubled in size, going from six teams to twelve. With this massive jolt, it would be expected to see the new teams – who were, after all, building their squads out of the castoffs from the existing teams – flounder in the standings.
The NHL decided on a total divisional split for the year: expansion teams were in the West Division, existing teams in the East. And the East’s fifth-place team (Toronto), which missed the playoffs completely, would have been the West Division champion on points. The East’s sixth-place team (Detroit), on the other hand, would have been fifth in the West and would have missed the postseason no matter what.
In the East, four of the six teams had a positive goal differential. Only fourth-place Chicago (-10) and sixth-place Detroit (-12) allowed more goals than they scored. In the West, all six teams had a negative goal differential: -6, -24, -14, -35, -21, and -66.
In games that were decided by three or more goals, Detroit was the only team in the East to have a losing record (10-12-0). In the West, only Philadelphia (11-11-0) had a non-losing record.
The two things that will be studied at some length in this post and in the next are simple: average goal differential and margin of victory, and competitive imbalance over time.
Blowout Games
None of the six expansion teams in 1967-68 had a winning record in games decided by three goals or more.
In 1970-71, incoming Buffalo and Vancouver had a combined 20-46-0 record in such games.
In 1972-73, newcomers Atlanta and New York (Islanders) were 11-17-0 and 4-40-0, respectively.
In 1974-75, poor Washington and Kansas City combined for a stunning 7-83-0 record in these games.
In 1979-80, the four teams absorbed from the WHA combined for a 47-81-0 record – Edmonton’s 14-15-0 record was the closest thing to a winning record by an expansion team in games decided by three goals or more in over a decade.
In 1991-92, San Jose was 8-28-0.
In 1992-93, Tampa Bay was 7-16-0 and Ottawa was 1-37-0.
In 1993-94, Florida was 8-9-0 and Anaheim 14-16-0. (Ottawa, in their second year, was 3-42-0)
In 1998-99, Nashville was 2-20-0.
In 1999-00, Atlanta was 4-34-0.
In 2000-01, Minnesota was 7-15-0 and Columbus 11-16-0.
And finally, in 2017-18, Vegas was 21-11-0 – the only team in the last half-century (plus) of expansion to have a winning record of any amount in their first year.
Which means…
There is a direct correlation between bad teams and bad records in high-margin games. This, I believe, is fairly obvious. But more to the point, there is also a correlation between bad teams and frequency of high-margin games. The Flames and Islanders entered the league in the same year; one had 65 points and one had 30. The former was part of 28 games that were decided by three goals or more, the latter 44 games.
The Lightning and Senators entered in the same year – to no one’s surprise, the team that was involved in 38 high-margin games had fewer than half the points of the one that in 23 games.
Nashville and Atlanta entered a year apart, but Atlanta was in 38 such games compared to just 22 for Nashville. Atlanta had double the number of wins in these games, but had just 39 points in their first year compared to 63 for Nashville.
Therefore…
If expansion causes dilution of the talent, it would cause a visible stratification of the league. Since the expansion teams are the ones most obviously affected, it would stand to reason that the rest of the league is benefiting at their expense.
What we would expect to see are a higher percentage of blowout games, as outlined above. We would also, either as a cause or as a symbiotic correlation, a spike in the average margin of victory per game.
But three goals per game, while certainly a respectable margin of victory, doesn’t tell the story. In recent years, we’ve seen teams becoming more aggressive when it comes to pulling their goalie when trailing at the end of a game. A hard-fought one-goal game can become a three-goal game just like that.
So I decided that what I would instead do would be to define a “blowout game” as one that’s double the league’s average margin of victory. If the average margin of victory is 1.5 goals per game, then a blowout game is a win of three goals or more. If the average is three goals per game, then a blowout game is a win by six or more goals. And so on.
This is where the games played database comes into play. It’s simply every game in NHL history, compiled into a massive spreadsheet, and sorted by season.
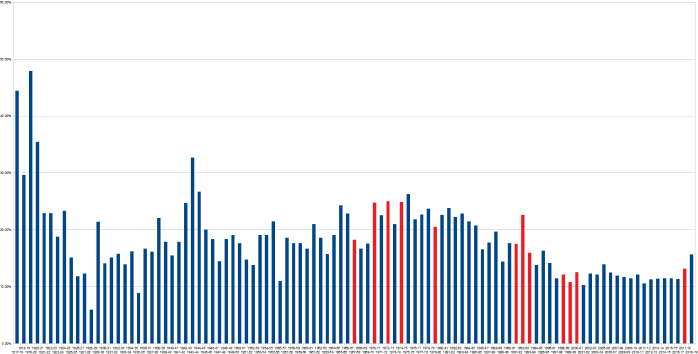
Then, figure out the average margin of victory, chart it, and color-code the modern expansion years in red.
So here it is. This is every season in NHL history.

Here’s what we see:
- A drop in the average margin of victory in 1967-68 and in 1979-80 from the preceding season. The latter was a strange year, since it was an absorption of teams and talent from the WHA.
- As expected, we see an upward in the expansion years of 1970-71, 1972-73, 1974-75, 1991-92, 1992-93, 1998-99, 2000-01, and 2017-18.
- On the other hand, we see drops in 1993-94 and 1999-00.
- We also see a further jump in the non-expansion year of 1975-76, which is only notable because of the fact that it came on the heels of a lot of expansion. On the other hand, this is an incredibly small jump – from 2.4888 in 1974-75 to 2.4959 in 1975-76. It’s a couple games here or there, and other factors may explain this.
- As I would have expected coming in, the World War II years – and specifically 1943-44 – demonstrate some of the most hideously unbalanced hockey in history.
What’s interesting to me, though, is how little movement there really is even across lengths of time. Every season since 1944-45 has had an average margin of victory between 1.8 and 2.5 goals per game.
If we toss out the WWII years of 1943-44 and 1944-45, this stretches back to 1935-36. And that season is the only one since 1928-29 to have fallen outside of this range (1.6614 goals/game).
In other words, if we remove the two big years of WWII, there has been exactly one year since the forward pass was legalized in all zones that the average margin of victory has been outside the 1.8-2.5 goals/game range.
So I decided to change gears a bit, and to define a blowout game as one in which a team wins by four or more goals. There’s a separate line for wins by five or more.
Scoring over time
Without context, this is all an incomplete picture. So here is what overall leaguewide scoring looks like, year-by-year, in terms of total goals per game.

I think – and this is just my opinion – that the margin of victory per game is a better indication of the quality of a league within a given season. Scoring totals, expressed as total goals/game, ebbs and flows in periods over time. Margin of victory does not – it may tie in with overall scoring trends, but it’s a better reflection of the distribution of talent at a given time.
You’ve heard that joke about the three statisticians that go hunting, right? They’re out in the woods and spot an enormous deer, standing perfectly still and in perfect range. Two of the statisticians raise their rifles, get a good sight, and pull the trigger. One misses ten feet to the left, the other misses ten feet to the right, and so the third one exclaims, “Got him!”
Raw averages – total goals/game as an example – are imprecise. More on that in a bit.
Teams near the top of the league standings in a given year will usually have a winning record in one-goal games, and an unusually good record in games decided by three or more goals per game. But to the latter point, they will normally have an unusual number of games that have that margin of victory. An average team will have a lesser number of high-margin games, and around a .500 record in them. And a bad team will have more three-goal games than one-goal, and a losing record in them.
Let’s look at the 1993-94 Rangers and Jets.
- New York had a 16-9-8 record in games decided by one goal or less, Winnipeg 10-15-9.
- New York was 21-9-0 in games decided by three goals or more, Winnipeg 7-26-0.
- New York was 39-16-5 against teams in their own conference, Winnipeg 13-35-6.
- In games decided by two goals, New York was 15-6-0, Winnipeg 7-10-0.
I just happened to be looking at the 1993-94 standings, so this wasn’t necessarily picked to prove a point. I could probably find two teams that mirror each other to an incredible extent, but I don’t know what would be gained from it.
What’s strange is that New Jersey, who was the second-best team in the regular season and was one of the best even-strength teams in history, actually had a losing record in one-goal games (9-10-12). On the other hand, they were 29-6-0 in games that were decided by three goals or more.
Overall goals/game as a measure of leaguewide scoring allows us to see what type of trends may exist, or what conditions may be changing over time. But it falls short as a measure of distribution of talent – it’s too imprecise. That’s where margin of victory per game comes in, which is poor for looking at longer-term trends but better for looking at diffusion of talent.
Blowouts
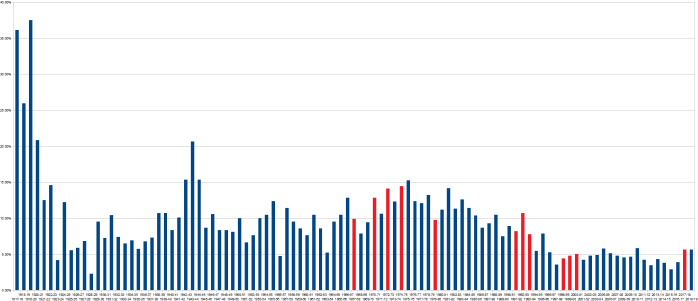
So, with “blowout” defined as games in which a team wins by four or more goals, exactly how frequent of an occurrence are these? Surely, we’d see them jump during expansion years – expansion teams are notorious for getting absolutely pummeled, and someone has to be doing the pummeling. The records above (under “Blowout Games”) show this trend very clearly.
So here we have the percentage of blowout games, year-by-year.
Neat, huh? The graph of blowout games over time tracks very closely with the one of average margin of victory per game, and less so with average leaguewide scoring. On one hand, this isn’t necessarily surprising; a blowout game will have a great impact on the average margin of victory, while close games will not.
But, there were years in which the average margin or victory crept up – and a blowout game should be more like five goals instead of four.
So, here’s a chart of games that involved a margin of victory of five goals or more:
A Shift in Tactics
What I would have expected to find was a bump in average margin of victory, percentage of blowout games, and in overall leaguewide scoring in 2017-18 when Vegas entered the league. This is exactly what happened.
And I would have expected this to fall back down for the 2018-19 season. This did not happen.
When I started compiling all of this data, I did so without having any idea what it would yield – if anything. There were a couple things that I expected to find, which is that I’d be able to clearly pinpoint the WWII years and the expansion years without them actually being labeled as such. This was surprisingly difficult, all things considered. The common narrative would have us believe that expansion is so bad for the league in the expansion year that the resulting evidence would be plainly obvious to anyone who looked at it, and that it would continue to ripple for years.
I’ll admit that I was surprised, and not pleasantly, to see the 2017-18 trends accelerate into 2018-19. It may continue to go into 2019-20, which we won’t know for a couple more months.
So I stared at the screen for about ten minutes or so, wondering how it is that so many NHL games which seem to be closely contested apparently yield a higher number of blowouts than in the immediate past. I was well past the point of just being “tired”, and the thought of a big error blowing up everything was a bit too much. So I went back, re-ran everything, and hoped that I’d simply missed a number or a formula or something.
I hadn’t.
Everything was the same.
So I started wondering, as the music of MØ drifted through the speakers, if there was a strategic change in recent years that I’d simply missed the boat on and wasn’t accounting for.
(Side note: I can work in total silence for extended periods of time. I may also need music in the background at times. Working at the frantic pace that I did for as long as I did introduced me to music I was previously unfamiliar with; I’d usually start with a single song on YouTube, and its automatically-generated “Up Next!” would carry on. It might be a similar song by a different artist, or it might continue on with the same artist. That’s how I was introduced to MØ, who I’d only heard a couple songs from previously [“Blur” with Foster the People, and “Lean On” with Major Lazer and DJ Snake]. I’d count myself as a fan now.)
After a few minutes, a thought hit me. What if teams were in fact becoming more aggressive when it came to late-game situations where they were trailing? An empty net goal against, after all, would shift the final score in one decisive moment. And since teams don’t pull the goalie when they’re already down by four goals, it wasn’t shifting from “blowout” to “not a blowout” from the same thing – it would be a one-way street.
So I dug into a bit, and discovered that this is exactly what was happening.
(Important note: empty net situational statistics were compiled from multiple different sources, which do not seem to exactly mesh with each other. I’m reluctant to go much further into this specific topic until I can find out if there’s something with the methodology or the compiling that is causing this.)
The 2013-14 Season
Let’s use 2013-14 as our sample season.
- 30 teams played a total of 1,230 games
- The total margin of victory was 2,447 goals, meaning that an average game was won by 1.989 goals
- Of the 6,751 goals scored, 3,536 were by the home team and 3,215 by the visitors
- There were no ties, as the shootout has eliminated that as a possibility
- 600 games (47.78%) were decided by one goal
- 260 games (21.14%) were decided by two goals
- 230 games (18.70%) were decided by three goals
- 87 games (7.07%) were decided by four goals
- 36 games (2.93%) were decided by five goals
- 11 games (0.89%) were decided by six goals
- 5 games (0.41%) were decided by seven goals
- 1 game, a 9-1 Anaheim victory over Vancouver on January 15 2014, was decided by eight goals
- No games were decided by nine or more goals
Seems pretty basic. But now let’s look at the empty net stats.
There were 223 empty net goals scored in the NHL in the 2013-14 season, but two of them were outside of what we’d consider “normal” empty net scenarios.
- On January 12, 2014, in a 5-3 loss, Edmonton’s Boyd Gordon scored a shorthanded empty-netter at 11:29 of the second period
- On March 29, 2014, in a 4-3 overtime loss, Buffalo’s Cory Conacher scored an empty-netter at 8:14 of the third period.
In both cases, the empty net goal was on a delayed penalty situation. The opposing team’s goalie vacated for the extra attacker, and the puck was accidentally passed into the empty net without first being handled by a player on the penalized team.
So we have 221 “normal” empty net goals scored in 2013-14. Of these:
- None were scored in a game that ended in a tie, obviously.
- None were scored in a goal that was decided by one goal. This does not warrant a dismissive “obviously”, since it’s not necessarily uncommon – 2013-14 is actually the only year in the last ten in which there have not been multiple one-goal games in which an empty-netter was scored by the winning team.
- 104 empty-netters were scored in games decided by two goals.
- 113 empty-netters were scored in games decided by three goals, and in five such games there were multiple empty-netters scored.
- 4 empty-netters were scored in games decided by four goals.
So what we have, then, are four games which would not have been considered “blowouts” that were pushed there on the basis of ENGs.
How does this stack up to the other years?
- In 2009-10, ten non-blowout games (out of 1,230) became blowouts due to ENGs
- In 2010-11, nine games (out of 1,230) became blowouts
- In 2011-12, eight games (out of 1,230) became blowouts
- In 2012-13, three games (of 720) became blowouts
- In 2014-15, twenty-one games (out of 1,230) became blowouts
- In 2015-16, thirty-three games (out of 1,230) became blowouts
- In 2016-17, fifteen games (out of 1,230) became blowouts
- In 2017-18, twenty-three games (out of 1,271) became blowouts
- In 2018-19, thirty-seven games (out of 1,271) became blowouts
The percentage of goals scored that are empty-netters has jumped as well, from 3.2884% in 2013-14 all the way up to 5.5128% in 2018-19.
So we see weird things starting to happen as well.
- In 2012-13, it looks like 11.25% of games were blowouts. The ENGs that pushed non-blowouts into blowouts was a small number, just three games, but the it’s enough to turn 10.83% into 11.25%.
- In 2013-14, 11.06% of games were blowouts…but ENGs makes that into 11.38%.
- In 2014-15, blowout games would have been 9.76% without ENGs – instead it’s 11.46%.
- 2015-16 sees 8.78% become 11.46%.
- 2016-17 sees 10.08% become 11.30%
- 2017-18, which is an expansion year, had the 11.33% of blowout games instead become 13.14%.
- 2018-19, the year which filled me with questioning and despair, went from 12.75% blowouts to 15.66%.
Well if you’re so sure what it ain’t, how about tellin’ us what it am?
Taking out empty net goals appears to give us a better idea of trends over time, but I’m not espousing doing this…yet.
There’s still a lot of research that needs to be done, specifically a hundred years worth of historical research, in order to figure out exactly how many games are being pushed to look like blowouts. Absent that, I’m not making any pronouncements about how meaningful the empty net shifts in recent years are – it certainly appears to be meaningful, but I won’t go beyond that.
This ten years worth of cursory research covers exactly one expansion cycle which had one expansion team. I’m looking at another 40-plus seasons before that as a starting point, covering twenty-four expansion teams.
Just from the ten years at a glance, as briefly outlined above, it all appears to buck historical trends. The number of empty net goals in a given season was probably between 100 and 150 starting with the 1979-80 season, and the overwhelming majority of those would have likely been in the last minute of the third period. This clearly no longer holds true today, where the numbers of ENG have erupted – from 178 in 2005-06 to 408 in 2018-19.
But in the next topic, we can set this aside and focus on a different team metric…
NEXT: Part 8 (Of course it looks like this, you see how bad the new team is!)
